Trade War Talking Points:
- The S&P 500 and US indices nudged higher to start the week, but fundamental attribution seemed a stretch beyond ‘follow through’
- There are fewer explicit key events to track but themes like trade wars and the US government shutdown have milestones to watch
- Dollar looks on the verge of collapse but fundamentals may for the break may leave us with a messy resolution
The fundamental risks are stacking up against the US Dollar as few themes can reliably be counted on for strong bullish motivation. See the Dollar forecast that James Stanley and I wrote – along with a range of global equities, crude oil and other key markets – for the first quarter on the updated forecasts on theDailyFX Trading Guides page.
Opening the Week to Sustained Fundamental Headwinds
We are opening the first full week of the trading year and there seems a certain degree of balance and optimism that seemed to be completely absent in the preceding few months. Between December’s painful tumble into technical bearish market territory (via the S&P 500) and the tentative but punchy rebound we see forming now, there has been decidedly little change to the primary fundamental currents that have established the course of the global markets. The sentiment of the masses ultimately determines what is important when it comes to pricing the market, but it is exceedingly rare that we switch from a strong bullish to bearish interpretation (and vice versa) of the same systemic issues in as short a time as just a few weeks. In other words, keep the bar for conviction in a true reversal high. Meanwhile, there remain high profile threats to conviction. The ongoing trade war between the United States and China – more accurately it is a global affair but these are the largest participants – remains the most far-reaching threat to global growth and financial stability. US Commerce Secretary offered words to suggest progress was being made on negotiations, but similar suggestions were made and reversed dramatically in tweets too many times before to engender serious conviction. As we await material progress in these two countries’ feud, keep an eye out for the scheduled meeting between the US, European Union and Japanese trade ministers on Wednesday. More topical, the US government shutdown grinds on and shaves US GDP down week-by-week. The President is due to give a press conference on the situation tomorrow evening. Depending on the outcome, it can potentially trigger volatility. As for other themes like the Fed’s policy relative to its global counterparts and the state of the world’s political stability, a little patience will bring those threats back to the forefront.
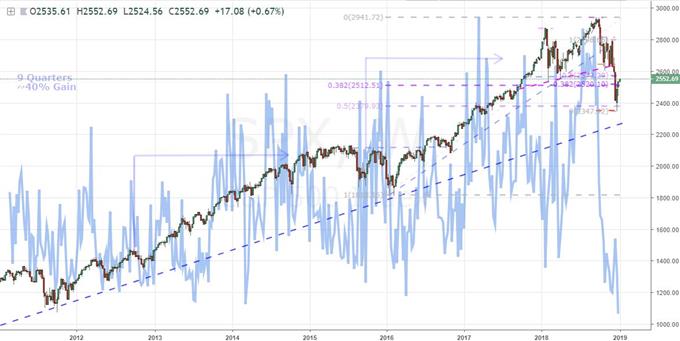
Chart of S&P 500 and the CBOE’s SKEW Tail Volatility Index (Weekly)
Risk Trends are Showing Preference When Conformity is Needed for Conviction
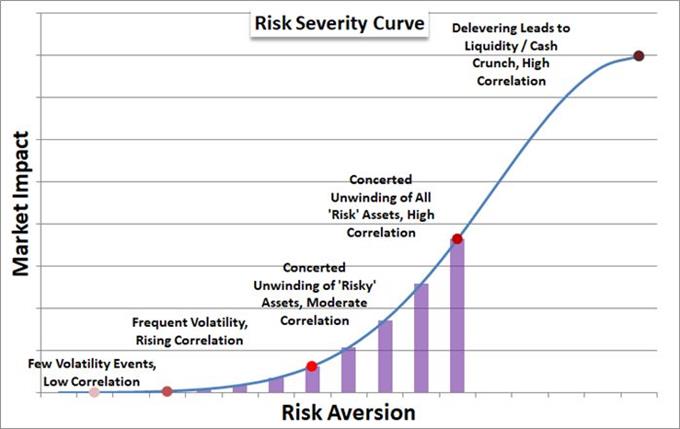
The tumble from risk-leaning assets between October and December was more acute for certain assets, but the trend was unmistakably uniform. Virtually all markets with a connection to risk or harboring a safe haven status were aligned to reflect a traditional and systemic risk aversion. There are few more certain signals that investor sentiment is under traction than seeing a pervasive correlation and momentum among otherwise distinct assets. That said, what are we to make of the recovery effort that is being made by key speculative benchmarks of late? US equities – represented by the S&P 500, Dow and Nasdaq 100 – have all started the week on a bullish footing to extend the past week’s recovery. This is tangible progress from the technical bear market the SPX registered on Christmas Eve, but we are getting to the point where deeper conviction is necessary to overcome a shift in speculative gravity. We have yet to overtake the upper bound on range support that held these standard-bearers up through much of 2018. Looking to equities around the rest of the global meanwhile shows little interest in partaking the indulgence to start this week. Emerging markets, interest rates and carry are all struggling for conviction that would take us to technically-relevant levels. It is a long and difficult journey for many of these benchmarks to simply return to their former highs, much less over take them. While possible, it is highly unlikely that they will all individually be capable of achieving that objective all of their own accord. Risk appetite may not have to be the motivation for that achievement, but it will have to at the very least be a contributor. And, there is little to suggest that is inevitable at this point.
Graph of Risk Intensity Curve
Dollar Stages as Reversal but Its Technical and Fundamental Prompts are Uneven
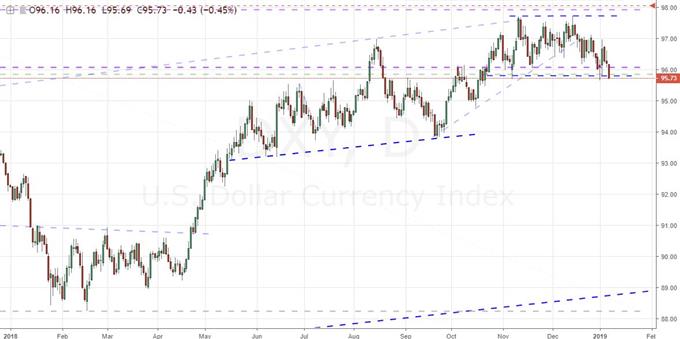
Among the assets with connection to sentiment trends, the US Dollar is one of the most frustratingly ambiguous. That means its present threat to reverse its bullish course doesn’t necessarily clarify the listlessness in speculative appetite. Nevertheless, the currency is posing a clear technical threat. The DXY’s trade-weighted index technically posted its lowest daily close since late October though its absolute range low over that period still stands. This looks unmistakably like a reversal threat, but traders should remember that breaks do not necessitate follow through. What do I mean by that? There are plenty of occasions through recent financial history where otherwise prominent technical levels (bullish and bearish across a wide variety of assets) have fallen only to see the markets achieving the breach stalling immediately after the milestone is surpassed. Follow through is predicated on the motivation for the break. Where will the bears stake their rally point? The need for an absolute safe haven has waned with the recent rebound in risk assets and the implied yield forecast through Fed Funds futures has imploded over the past few months but are notably higher since this past Friday’s NFPs beat. I am a medium-term bear (as can be seen in the first quarter US Dollar forecast I contributed to with James Stanley), but that doesn’t mean it is actionable from day one. Pairs like EURUSD may look the part, but follow through will struggle as much with the density of resistance above 1.1500 as they would sorting out the fundamental confusion. As for other majors, the picture is even more technically opaque. Patience is a virtue.
Chart of the DXY Dollar Index (Daily)
Euro, Pound and Loonie Progress Anchored While Oil May Continue Unburdened
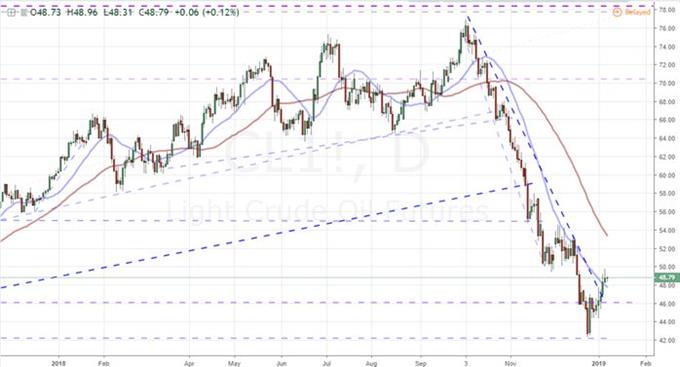
If you’re monitoring the bearing of the Dollar, there is benefit in monitoring its major counterparts – one of the most pervasive winds for the benchmark currency in recent history has been the collective rise and fall of its major peers. If that is your anticipated source of motivation, however, the future is still very murky. EURUSD is on the verge of a high-profile break, but the Euro itself is simply listless. This past session offered up an investor sentiment reading that cooled from the previous month and there is high probability that the economy, consumer, business equivalents due later today offer up the same. Yet, these do not tap into the oscillating concerns of ECB timing, political stability and trade stability with the US that tend to command volatility for the single currency. As we should have grown acclimated to, the Pound is awaiting its cue to mark a clear path when Brexit is offered its path for better or worse – and that may not come until the March 29 Brexit cut off or even later. The Canadian Dollar has enjoyed a five-day run and the biggest equivalent slide for USDCAD in two-and-a-half years, but the market will be tuned into the Bank of Canada (BOC) rate decision coming up this week to ensure pace. One of the more technically-inspired and fundamentally intendent moves currently underway is oil’s slow climb back towards 50. I rarely follow technicals to the exclusion of fundamentals, but here supply-and-demand has clearly taken a back set to speculative needs. We update on the markets to start this new week in today’s Trading Video.
Chart of US-based WTI Crude Oil with 20-day and 50-day Moving Averages (Daily)
If you want to download my Manic-Crisis calendar, you can find the updated file here.