ASX 200 Technical Analysis Talking Points:
- The ASX 200 is close to the top of its very short-term range
- Bulls may have the impetus to break that and go on to the last significant peak
- If they can’t however, the nine-year uptrend could be threatened
Get live, interactive coverage of all major Australian economic data at the DailyFX Webinars
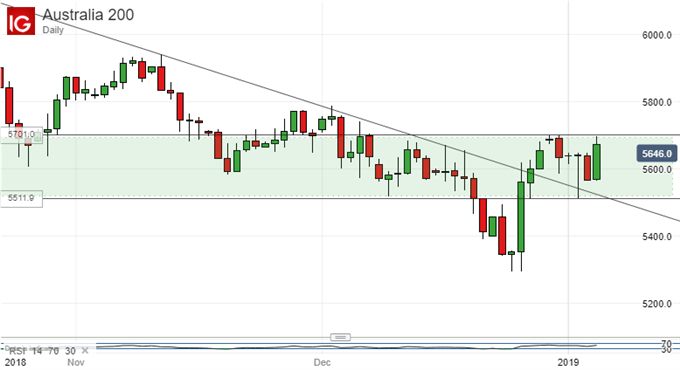
The ASX 200 seems to be attempting to break out of its current trading range to the upside, but it’s still very early in 2019 and new trading patterns should probably be treated with a bit of caution.
That range top comes in around 5,700 and it has held the bulls in check when they’ve tested it on an intraday and daily-close basis for a week now. Indeed the ASX has not been over that point since December 4, and was only above it for a matter of days even then.
Should the Sydney stock benchmark manage to close durably above that line then the next significant target for the bulls will be 5794.3. That is the most recent significant peak and was marked on an intraday basis back on December 3.
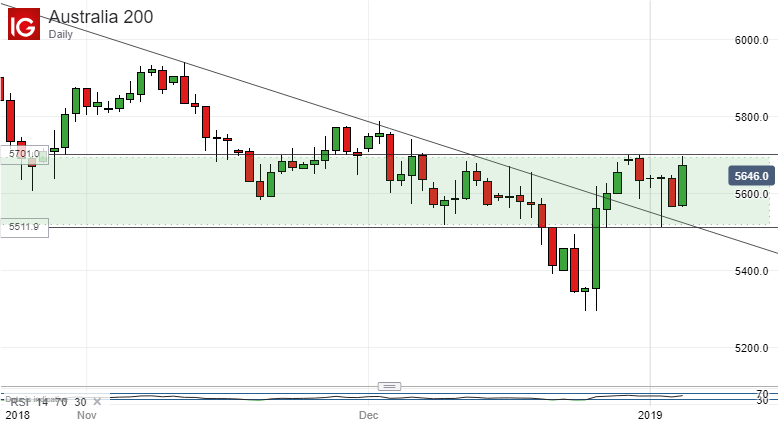
However, consolidation around that area would see the index well above the downtrend line which held good for much of 2018’s second half and above which it has spent very little time since August. If the ASX cannot make durable progress above that December 3 peak then it probably makes most sense to play for a resumption of that downtrend in the coming weeks.
A look at the monthly chart reveals just how important the opening months of 2019 could be for the ASX. The index is now flirting with the bottom of another uptrend channel. This one has marked progress from the nadirs of the financial crisis, when the index was more than 2,600 points below current levels.
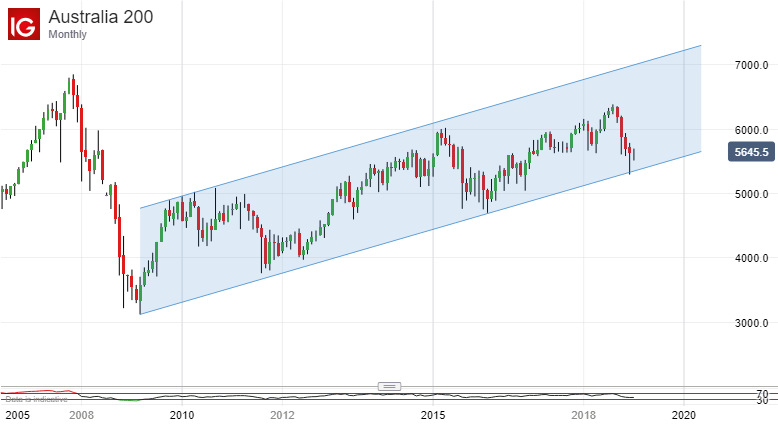
A monthly close below this channel need not be immediately catastrophic for ASX bulls, but it would surely sound a cautionary note, at least. Even within the channel the index is back to lows not previously seen since late 2016.
Tactically then it might be best to see what becomes of December 3’s peak, while strategically the fate of the longer-term uptrend is probably the thing to watch.
Resources for Traders
Whether you’re new to trading or an old hand DailyFX has plenty of resources to help you. There’s our trading sentiment indicator which shows you live how IG clients are positioned right now. We also hold educational and analytical webinars and offer trading guides, with one specifically aimed at those new to foreign exchange markets. There’s also a Bitcoin guide. Be sure to make the most of them all. They were written by our seasoned trading experts and they’re all free.
— Written by David Cottle, DailyFX Research
Follow David on Twitter@DavidCottleFX or use the Comments section below to get in touch!