Sterling (GBP) Price, Chart and Analysis
- UK chancellor Sajid Javid rules out being a ‘rule taker’ post-Brexit.
- Sterling also starting to price-in a potential UK interest rate cut next week.
British Pound (GBP) Opens Lower on Disorderly Post-Brexit Trade Talks
Sterling continues to drift lower against a range of other currencies with the mini sell-off fueled by commentary from UK chancellor Sajid Javid over the weekend. Mr. Javid made it quite clear that the UK will not remain in alignment with the EU after January 31 and will not be a ‘rule taker’ from Brussels. In an interview with the Financial Times, the chancellor stressed ahead of upcoming trade talks that “There will not be alignment, we will not be a ruletaker, we will not be in the single market and we will not be in the customs union — and we will do this by the end of the year.” The EU has already said that the UK must align with the EU – become a rule taker – as part of any new trade agreement.

Recommended by Nick Cawley
Download our Brand New Q1 Sterling Forecast
GBP/USD Price Nears Support Zone as BoE Rate Cut Talk Increases
Cable continues to drift back down to prior support levels as market expectations of a 0.25% UK interest rate cut at the end of January increase. Friday’s worse-than-expected UK retail sales data and dovish commentary from various BoE MPC members have pushed expectations to the extent that a cut is now expected. Various UK data this week will give a better picture of the UK economy with Wednesday’s CBI business trends and Friday’s Markit PMIs the most closely watched. Both these releases are for January and may be decisive either way for Sterling.
For all market moving data releases and events, please see the DailyFX Calendar.
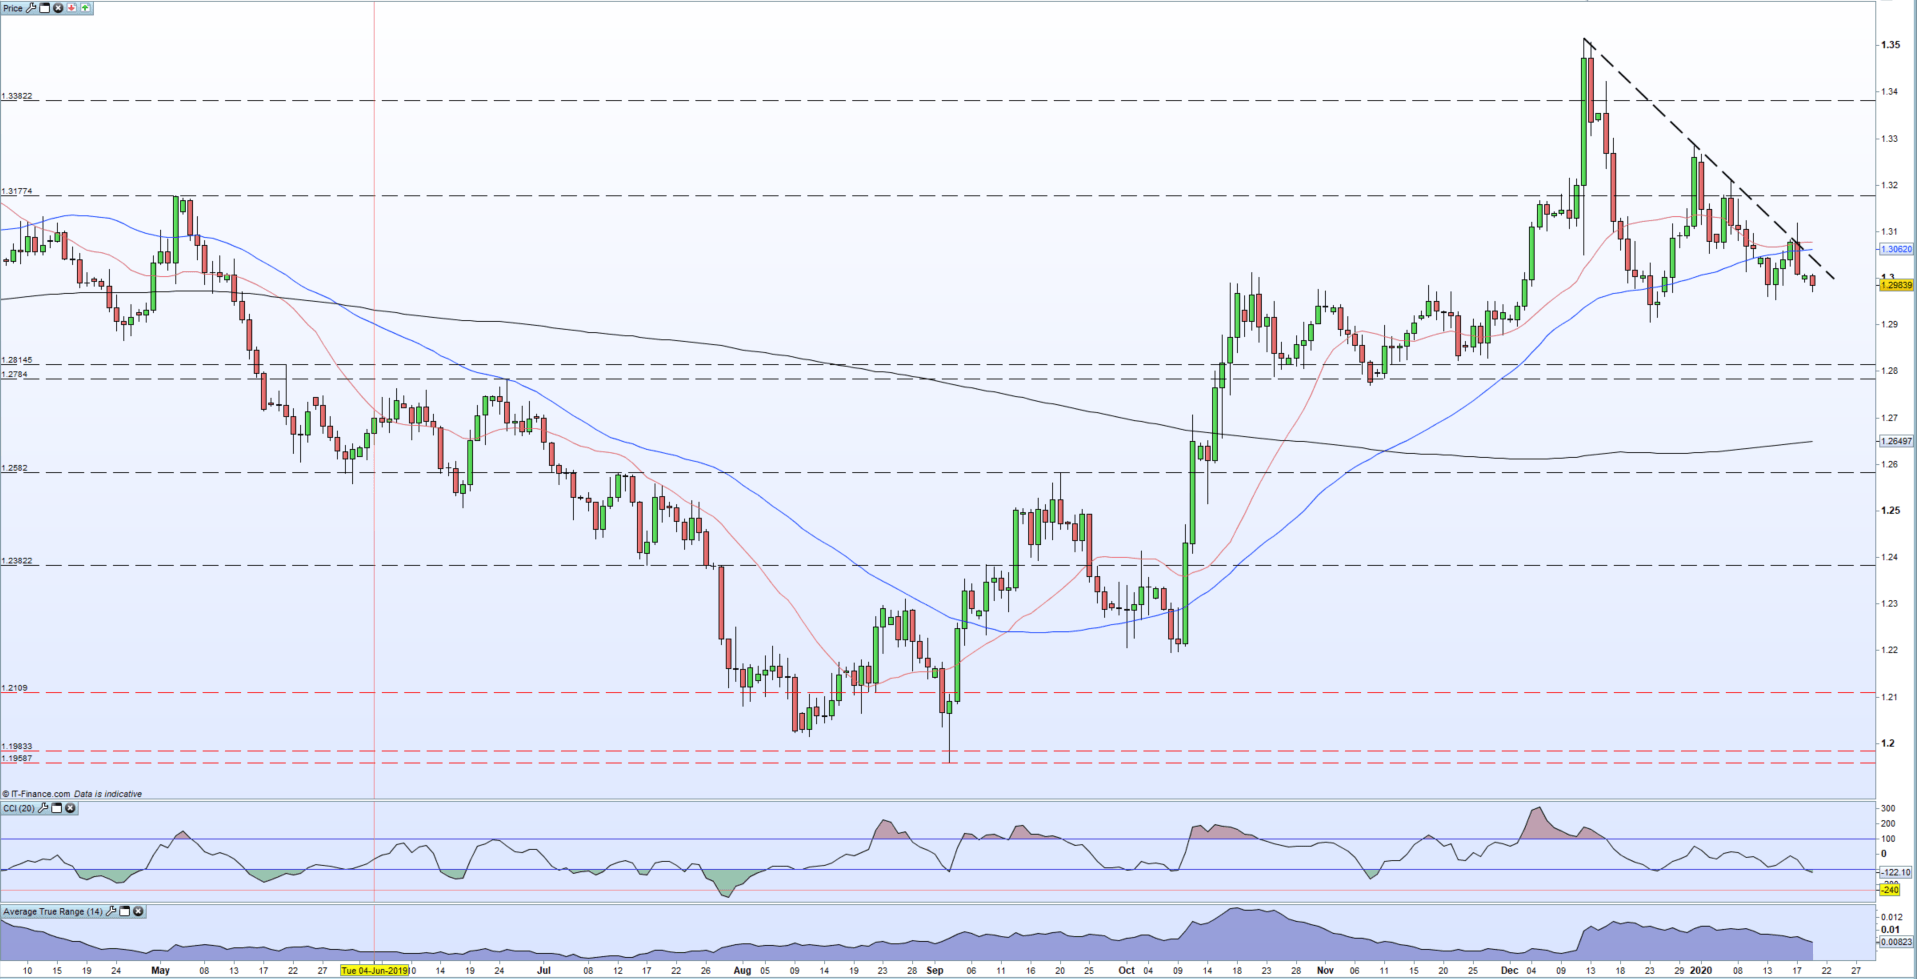
GBPUSD trades either side of 1.2980 with trend resistance of the December 12 spike high at 1.3512 in control of price action. The 1.2950 to 1.2970 level has prompted buying in the past month and may see cable push higher again. Below here, the next level of support is the December 23 low at 1.2904. The current downtrend currently cuts across around 1.3040, while a cluster of recent highs and the 20- and 50-day moving averages block the path up to 1.3120. The CCI indicator suggests that the market is becoming oversold.
GBP/USD Daily Price Chart (April 2019 – January 20, 2020)
| Change in | Longs | Shorts | OI |
| Daily | 5% | 11% | 7% |
| Weekly | 1% | 3% | 2% |
Traders may be interested in two of our trading guides – Traits of Successful Traders and Top Trading Lessons – while technical analysts are likely to be interested in our latest Elliott Wave Guide.
What is your view on Sterling (GBP) – bullish or bearish?? You can let us know via the form at the end of this piece or you can contact the author at nicholas.cawley@ig.comor via Twitter @nickcawley1.