
Post-Brexit Trade Talks and Sterling (GBP) Prices and Analysis:
- GBP/USD up in excess of 160 pips this week.
- FTSE 100 drifts lower as Sterling strength hurts UK exporters.
GBP/USD Consolidating Recent Gains
A good week for Sterling bulls with GBP/USD up over 160 pips so far, with most of those gains made Thursday. The driver for the move was the announcement that PM Boris Johnson had installed a new chancellor of the exchequer in No.11 Downing Street, after incumbent Sajid Javid resigned. The new chancellor, Rishi Sunak, is fully expected to embark on a program of fiscal largesse, to help boost the economy, taking the pressure off the Bank of England to loosen monetary policy further.
Post-Brexit trade talks are expected to start in the next two weeks and the opening gambits by both sides may well derail talks before they get fully underway. Both sides have outlined their ‘red lines’ and the gap between the two is wide enough to stall talks.
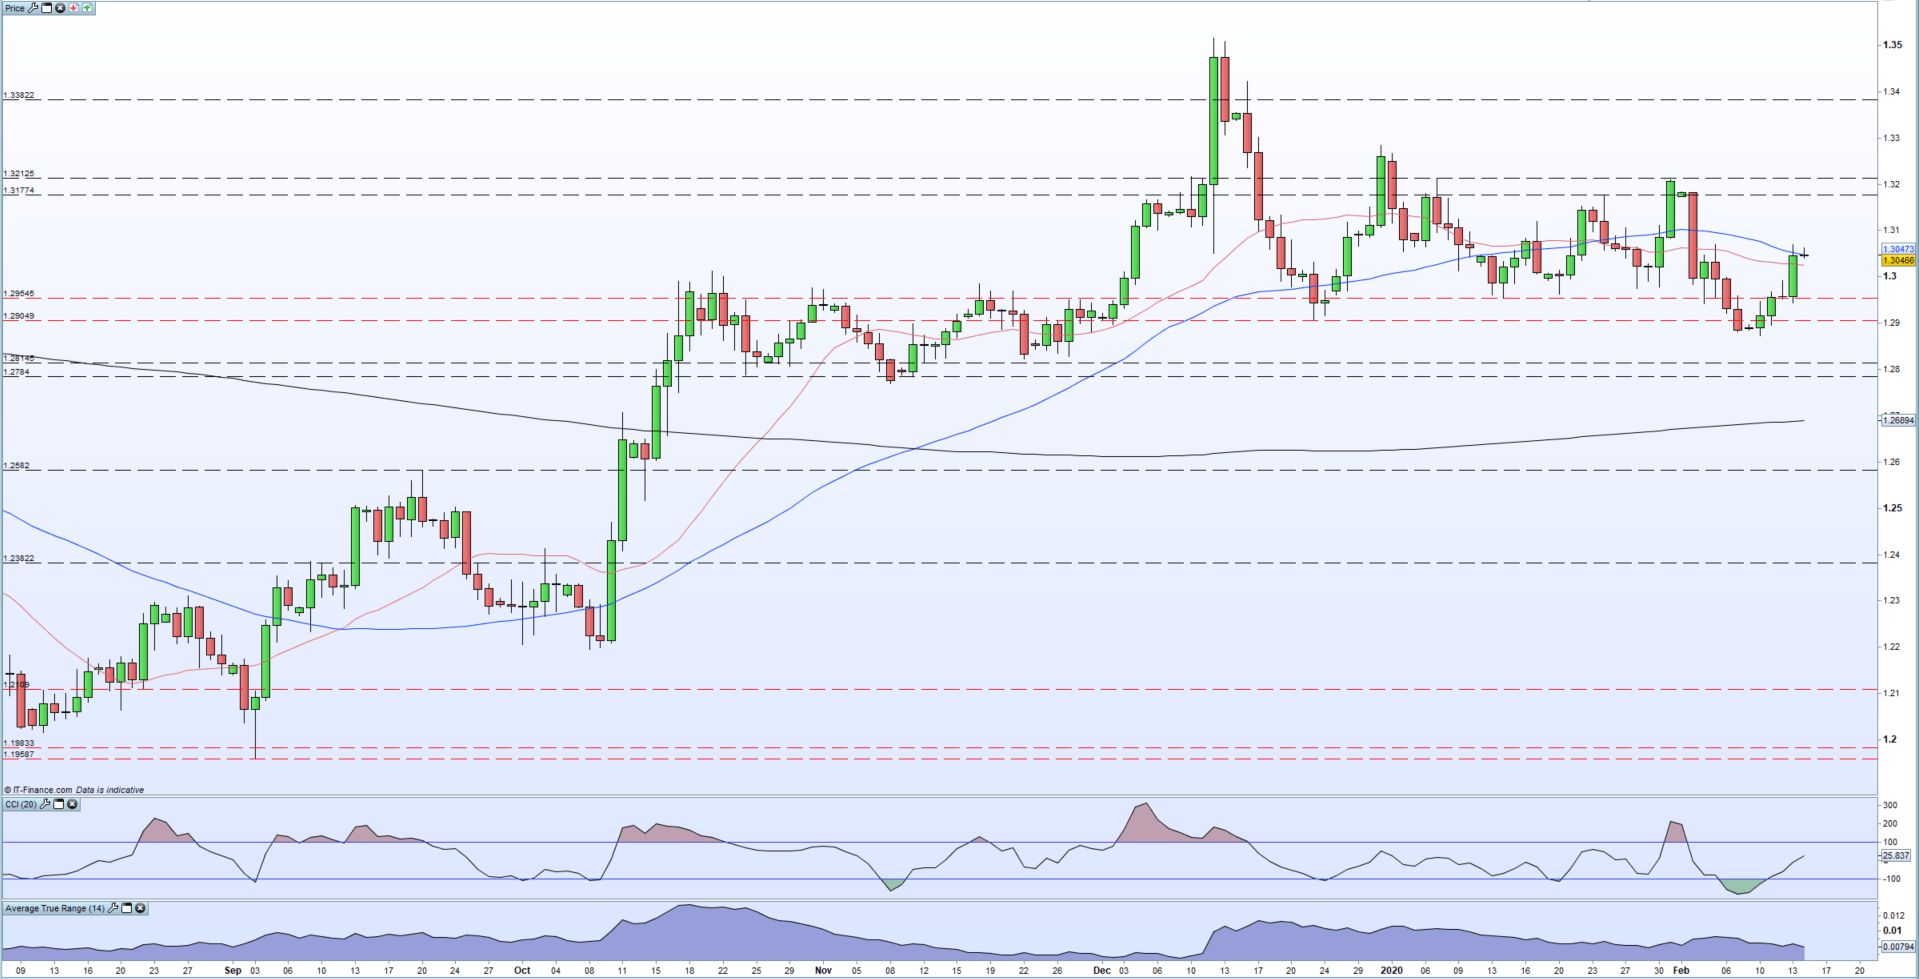
GBPUSD is currently trading just above both the 20- and the 50-day moving average, highlighting the positive sentiment in Sterling. There is a strong seam of support between 1.2905 and 1.2955 that has been tested but not broken with conviction since early-November 2019. This support should hold and will help push the pair higher in the short-term. The first level of resistance is marked at 1.3070 before a gap up to 1.3177.

Recommended by Nick Cawley
Download our Brand New Q1 Sterling Forecast
GBP/USD Daily Price Chart (August – February 14, 2020)
| Change in | Longs | Shorts | OI |
| Daily | 26% | -20% | 9% |
| Weekly | 41% | -21% | 17% |
FTSE 100 Drifts into Support
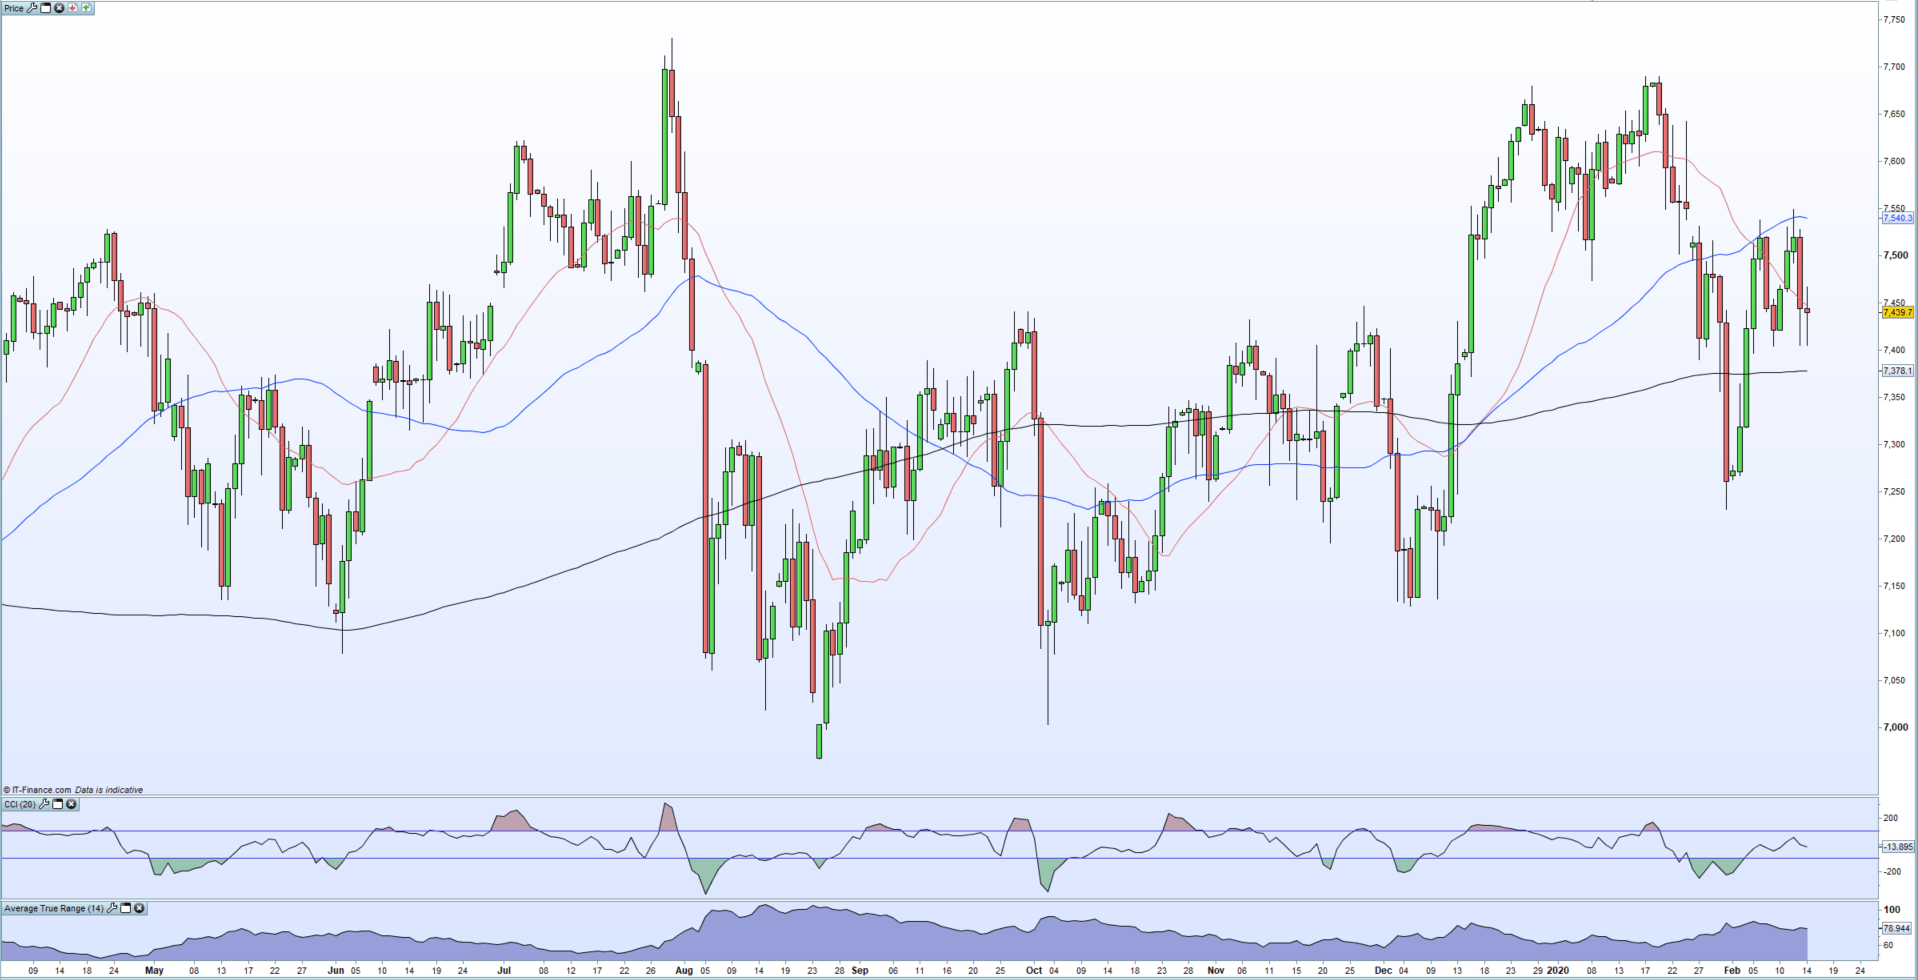
The UK 100 has given back any of this week’s gains and currently trades flat for the period. Thursday’s rally in the British Pound weighed on UK exporters, pulling their share prices lower, while ongoing fears over the spread of the Chinese flu-virus, has seen investors take some risk off the table. The first level of short-term support is seen either side of 7,400, before the 200-dma cuts across at 7,378.
Everything You Need to Know About Types of Stocks
FTSE 100 Daily Price Chart (April 2019 – February 14, 2020)
Traders may be interested in two of our trading guides – Traits of Successful Traders and Top Trading Lessons – while technical analysts are likely to be interested in our latest Elliott Wave Guide.
What is your view on Sterling (GBP) and the FTSE 100 – bullish or bearish?? You can let us know via the form at the end of this piece or you can contact the author via Twitter @nickcawley1.