DAX 30 & CAC 40 Forecast:
DAX 30 & CAC 40 Price Forecast Tied to Nearby Fibonacci Levels
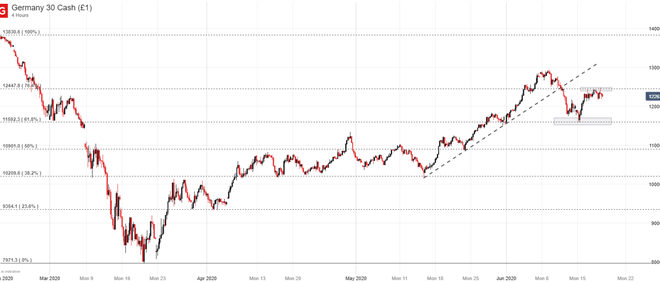
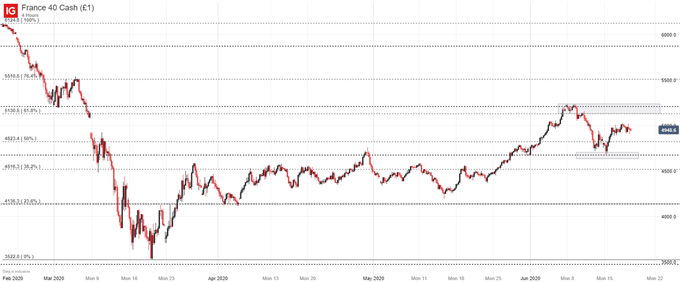
Recent swings in risk trends have seen the DAX 30 and CAC 40 follow suit as the two indices fluctuate between their respective levels of support and resistance. Coincidentally, both indices appear to derive some degree of influence from the Fibonacci sequence drawn from the peak and trough of the coronavirus crash. While the CAC 40 lags the DAX 30, both are in the midst of a recovery that has been contained in recent weeks and, as a result, price action has begun to display range-bound characteristics.
DAX 30 Technical Outlook
In the case of the DAX 30, resistance in question resides at the nearby Fibonacci level around 12,448. After failing to contain price in early June, the recent retracement has afforded the technical barrier a second chance and price action in the last few days suggests the level still possesses some ability to keep price under wraps. Whether the recent pullback was an opportunity for consolidation or the beginning of further volatility is yet to be seen, a modest uptick in volatility on Thursday may hint at further instability to come.
DAX 30 Price Chart: 4 – Hour Time Frame (February 2020 – June 2020)
Either way, the DAX will have to clear 12,448 before it can attack the June peak near 12,935 which marks the next major area of interest. In terms of support, the German equity index will likely look to 11,592 – as it has in the past – for assistance. If risk aversion reemerges before the DAX can break above 12,448, it might suggest the index has slipped into a new range, similar to the one it was locked in during early April to mid-May. In the meantime, follow @PeterHanksFX on Twitter for updates and analysis.
| Change in | Longs | Shorts | OI |
| Daily | -7% | 14% | 4% |
| Weekly | -7% | 26% | 9% |
CAC 40 Technical Outlook
The CAC 40 runs the risk of a similar fate as it bounces between resistance around 5,130 and 5,210 to support near 4,670 despite falling behind the DAX 30 in its recovery. Regardless, it seems investor sentiment will be the driving force behind the index for the days to come as tangible developments – whether bullish or bearish – have failed to have a notable impact. Thus, range trading opportunities may arise on the CAC 40 between the two areas outlined above which could offer traders with an attractive risk-reward profile.
CAC 40 Price Chart: 4 – Hour Time Frame (February 2020 – June 2020)
| Change in | Longs | Shorts | OI |
| Daily | -11% | 30% | 7% |
| Weekly | -2% | 26% | 11% |
–Written by Peter Hanks, Analyst for DailyFX.com
Contact and follow Peter on Twitter @PeterHanksFX


