EURGBP TECHNICAL ANALYSIS
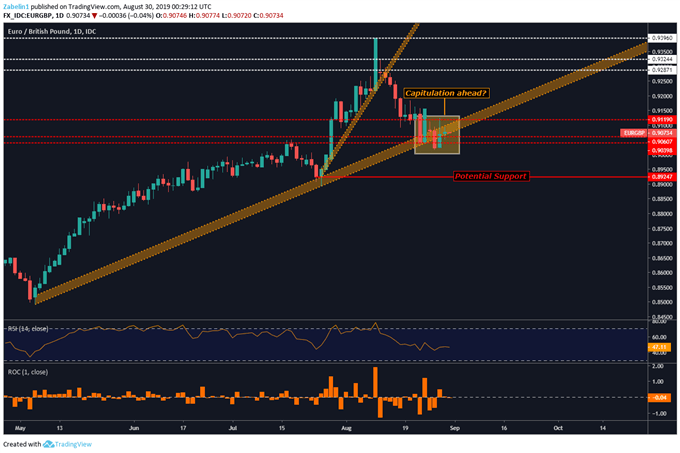
- EURGBP struggling to remain above three-month rising support channel
- Capitulation may result in significant selloff, exposing support at 0.8924
- Brexit protests, risks of no-deal outcome may reverse pair’s rapid retreat
See our free guide to learn how to use economic news in your trading strategy!
After rapidly descending from its three-year high and breaking below a three-week rising support channel, EURGBP is now struggling to remain above a multi-month floor and other critical price levels. A break below the three-month rising support zone with follow-through exposes the pair to the 0.8924 price level.
EURGBP – Daily Chart

EURGBP chart created using TradingView
However, short sellers may be reluctant to commit capital over uncertainty about Brexit. With a currency like GBP being linked to a fundamentally volatile environment, technical analysis is even more difficult to perform as the political landscape continues to shift.
Traders with long positions may wait to add exposure until the pair clear key resistance at 0.9119. A break above this level with follow-through could give investors enough confidence to reconsider committing more capital. Until then, they may choose to wait.
Zooming out, the weekly candle for the last breath of August is showing indecision with long wicks on both ends of a short body. It is sitting right at the lower crust of the rising support channel. If broken, it could be the start of a rapid decline after closer higher for 14-consecutive weeks. Until there is confirmation, traders may surmise that the most optimal approach is to wait.
EURGBP – Weekly Chart

EURGBP chart created using TradingView
EURGBP TRADING RESOURCES
— Written by Dimitri Zabelin, Jr Currency Analyst for DailyFX.com
To contact Dimitri, use the comments section below or @ZabelinDimitrion Twitter