
Euro Forecast Overview:
- After the Euro’s best performance in nearly a decade last month, the currency has been able to maintain its gains in pairs like EUR/JPY and EUR/USD.
- Although EUR/USD rates remain stuck in their bull flag, EUR/JPY rates have recent rallied off of former resistance, validating a critical area as support at an opportune time.
- Per the IG Client Sentiment Index, the Euro has a mixed if not bearish bias.

Recommended by Christopher Vecchio, CFA
Get Your Free EUR Forecast
Euro May Not Be Done Yet
The Euro’s impressive month of July (the best monthly performance since September 2010) has not seen quite the same follow through into August, although the stage is set for further Euro gains as the summer doldrums winddown. The two major EUR-crosses, EUR/JPY and EUR/USD, have made significant technical strides in recent weeks, insofar as breaking through key resistance areas and maintaining gains in price action. Trading is a function of both price and time, and given that time continues to pass where these key resistance levels are broken, it would hold that they are becoming less of a burden for Euro rates to continue their climb.
EUR/USD RATE TECHNICAL ANALYSIS: WEEKLY CHART (November 2016 to August 2020) (CHART 1)
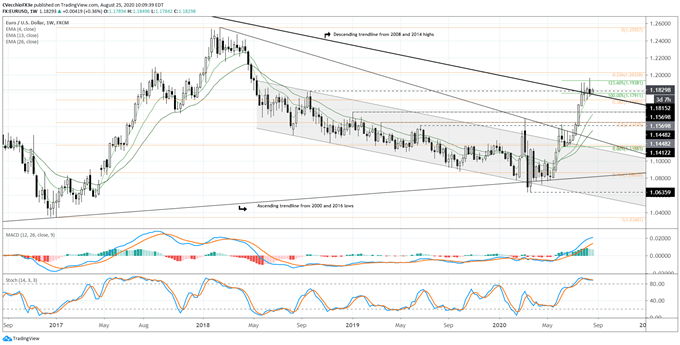
EUR/USD rates have been steadying near a significant near-term resistance zone that holds several important levels: the 38.2% retracement of the 2017 low/2018 high range comes in at 1.1709 (as indicated by the orange Fibs in Charts 1 & 2); taking the move from the European Recovery Fund announcement date in May, to the June high and to the June low (within the symmetrical triangle), and the 100% Fibonacci extension (as indicated by the green Fibs in Charts 1 & 2) comes in at 1.1791; lastly, the descending trendline from the 2008 and 2014 highs is nearby at 1.1800.
As previously noted, “a breakout through this zone (roughly 1.1709 to 1.1800) would be a significant long-term bullish development for EUR/USD rates. EUR/USD rates are above their weekly 4-, 13, and 26-EMA envelope, while weekly MACD is pushing higher and Slow Stochastics are lingering in overbought territory.” It is necessary to view the consolidation in recent weeks around these levels as a bull flag given the context of the preceding uptrend.
EUR/USD RATE TECHNICAL ANALYSIS: DAILY CHART (August 2019 to August 2020) (CHART 2)
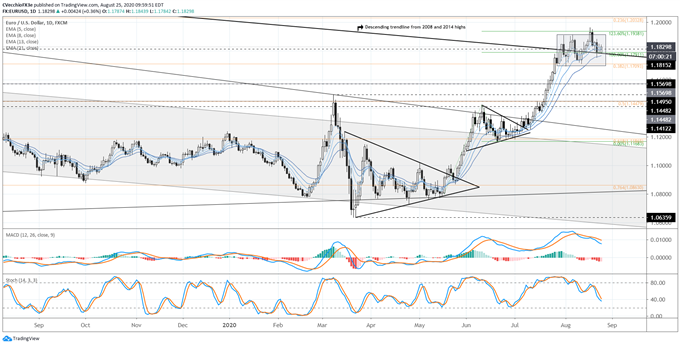
EUR/USD rates are holding above their daily 5-, 8-, 13-, and 21-EMA envelope (which is still in bullish sequential order). Daily MACD, while cooling off, is still in bullish territory, and Slow Stochastics have been neutralized; EUR/USD rates are at the same levels they were when both daily MACD and Slow Stochastics were in more overbought territory. Bulls appear to be firmly in control; a break above the 123.6% Fibonacci extension (1.1938) would suggest the next leg higher has started.
IG Client Sentiment Index: EUR/USD Rate Forecast (August 25, 2020) (Chart 3)
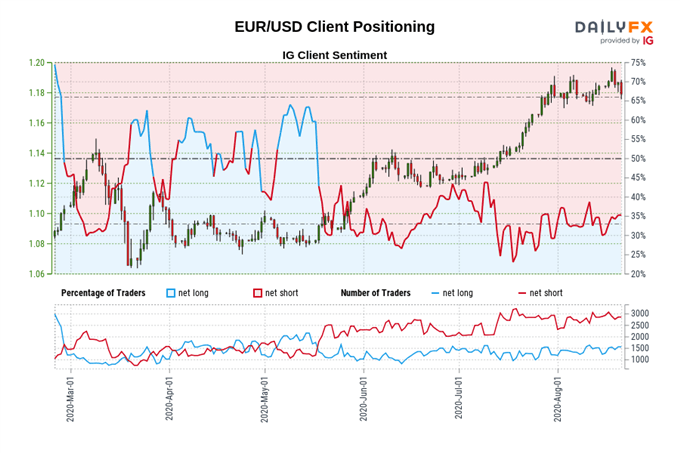
EUR/USD: Retail trader data shows 39.68% of traders are net-long with the ratio of traders short to long at 1.52 to 1. The number of traders net-long is 7.62% higher than yesterday and 12.35% higher from last week, while the number of traders net-short is 16.85% lower than yesterday and 16.91% lower from last week.
We typically take a contrarian view to crowd sentiment, and the fact traders are net-short suggests EUR/USD prices may continue to rise.
Yet traders are less net-short than yesterday and compared with last week. Recent changes in sentiment warn that the current EUR/USD price trend may soon reverse lower despite the fact traders remain net-short.
EUR/JPY RATE TECHNICAL ANALYSIS: DAILY CHART (August 2019 to August 2020) (CHART 4)
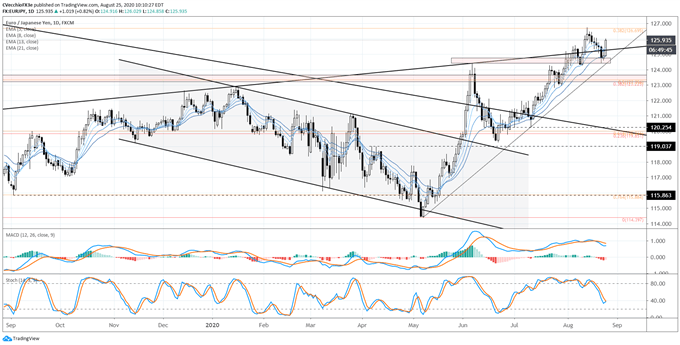
After hitting the 38.2% Fibonacci retracement of the 2018 high/2020 low range at 126.70, EUR/JPY rates quickly pulled back to a familiar zone – the area around 124.50, which had served as resistance in June and had already proven itself as support in early-August. But EUR/JPY rates are proving resilient, and have started to treat the uptrend from September 2012, September 2016, and January 2019 swing lows as support once more.
EUR/JPY rates are rising above their daily 5-, 8-, 13-, and 21-EMAs, which remains in bullish sequential order. Daily MACD’s drop in bullish territory is tailing off, while Slow Stochastics are starting to turn higher at their neutral line. The path of least resistance appears to be to the topside for EUR/JPY rates in the near-term.
IG Client Sentiment Index: EUR/JPY Rate Forecast (August 25, 2020) (Chart 5)
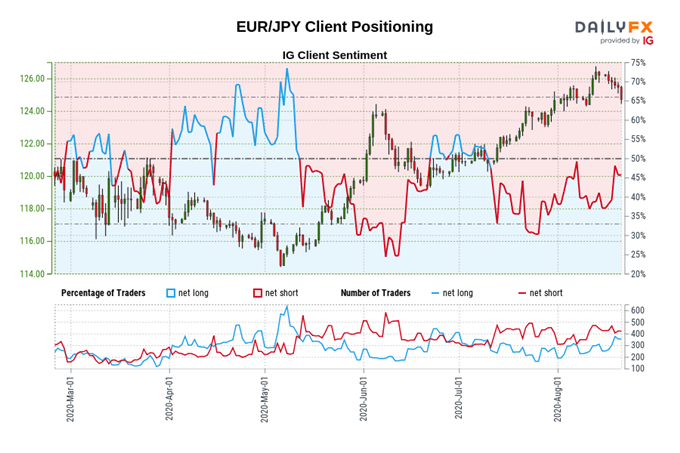
EUR/JPY: Retail trader data shows 46.46% of traders are net-long with the ratio of traders short to long at 1.15 to 1. The number of traders net-long is 3.21% lower than yesterday and 18.90% higher from last week, while the number of traders net-short is 15.74% lower than yesterday and 25.48% lower from last week.
We typically take a contrarian view to crowd sentiment, and the fact traders are net-short suggests EUR/JPY prices may continue to rise.
Yet traders are less net-short than yesterday and compared with last week. Recent changes in sentiment warn that the current EUR/JPY price trend may soon reverse lower despite the fact traders remain net-short.

Recommended by Christopher Vecchio, CFA
Traits of Successful Traders
— Written by Christopher Vecchio, CFA, Senior Currency Strategist