British Pound Rate Talking Points
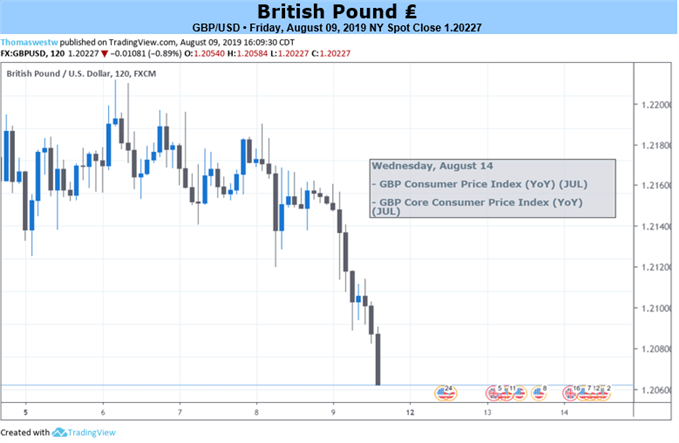
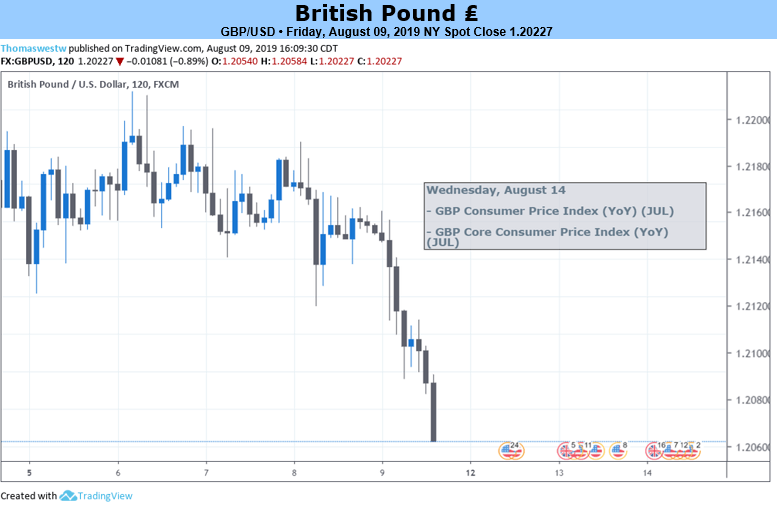
GBPUSD trades near the 2019-low (1.2079) even though the Bank of England (BoE) sticks to the sidelines in August, and fresh developments coming out of the UK may do little to heighten the appeal of the British Pound amid the growing threat of a no-deal Brexit.
Fundamental Forecast for British Pound: Bearish
The British Pound may face a more bearish fate over the coming days as Prime Minister Boris Johnson remains adamant that the UK will depart from the European Union (EU) no later than the October 31 deadline, with the new leader hopeful that “our friends and partners will show common sense and that they will compromise.”
The comments suggest Mr. Johnson will make a hard push to renegotiate with less than 100 days till the deadline, but little indications of a potential trade deal may become a growing concern for the BoE as “the appropriate path of monetary policy will depend on the balance of the effects of Brexit.”
In turn, the Monetary Policy Committee (MPC) may adopt a dovish tone at the next meeting on September 19, and fresh data prints coming out of the economy may push the central bank to alter the forward guidance for monetary policy as “underlying growth appears to have slowed since 2018 to a rate below potential.”
The BoE may turn a blind eye to the UK employment report even though the economy is anticipated to add 107K jobs in June as the Consumer Price Index (CPI) is expected to slow to 1.9% from 2.0% per annum, while Retail Sales are projected to contract 0.2% in July.
Signs of a less robust economy may produce headwinds for the British Pound as it encourages the BoE to switch gears in 2019, but retail positions remain skewed even though GBPUSD trades near the yearly-low (1.2079).
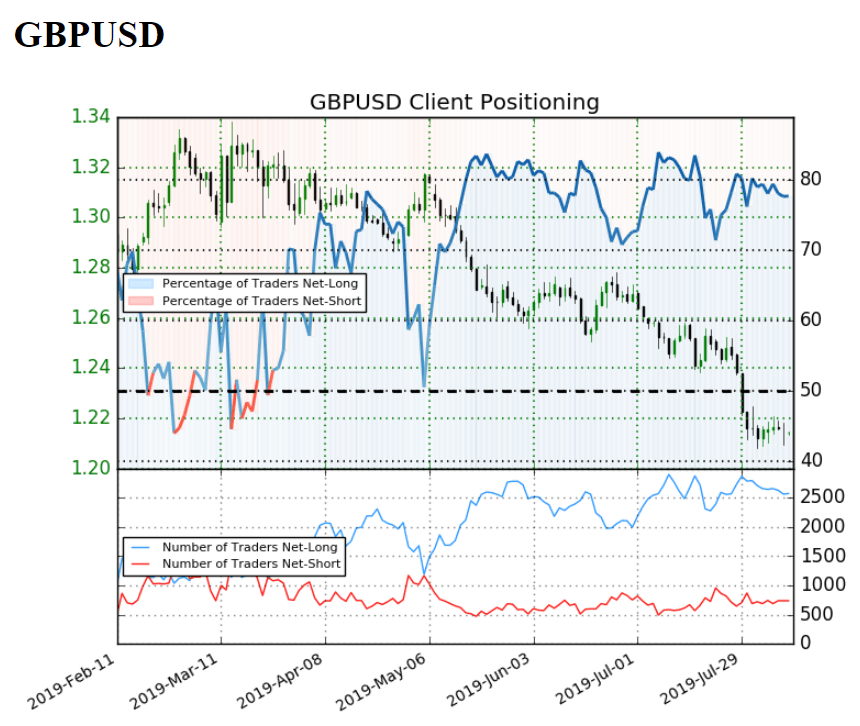
The IG Client Sentiment Report shows 77.7% of traders are still net-long GBPUSD compared to 81.2%last week, with the ratio of traders long to short at 3.47 to 1.
In fact, traders have remained net-long since May 6 when GBPUSD traded near the 1.3100 handle even though price has moved 7.3% lower since then. The number of traders net-long is 1.6% lower than yesterday and 6.2% lower from last week, while the number of traders net-short is 0.9% lower than yesterday and 0.8% lower from last week.
The ongoing tilt in retail position offers a contrarian view to crowd sentiment amid the trending market, with both price and the Relative Strength Index (RSI) tracking the bearish formations from earlier this year.
Sign up and join DailyFX Currency Strategist David Song LIVE for an opportunity to discuss potential trade setups.
GBP/USD Rate Daily Chart
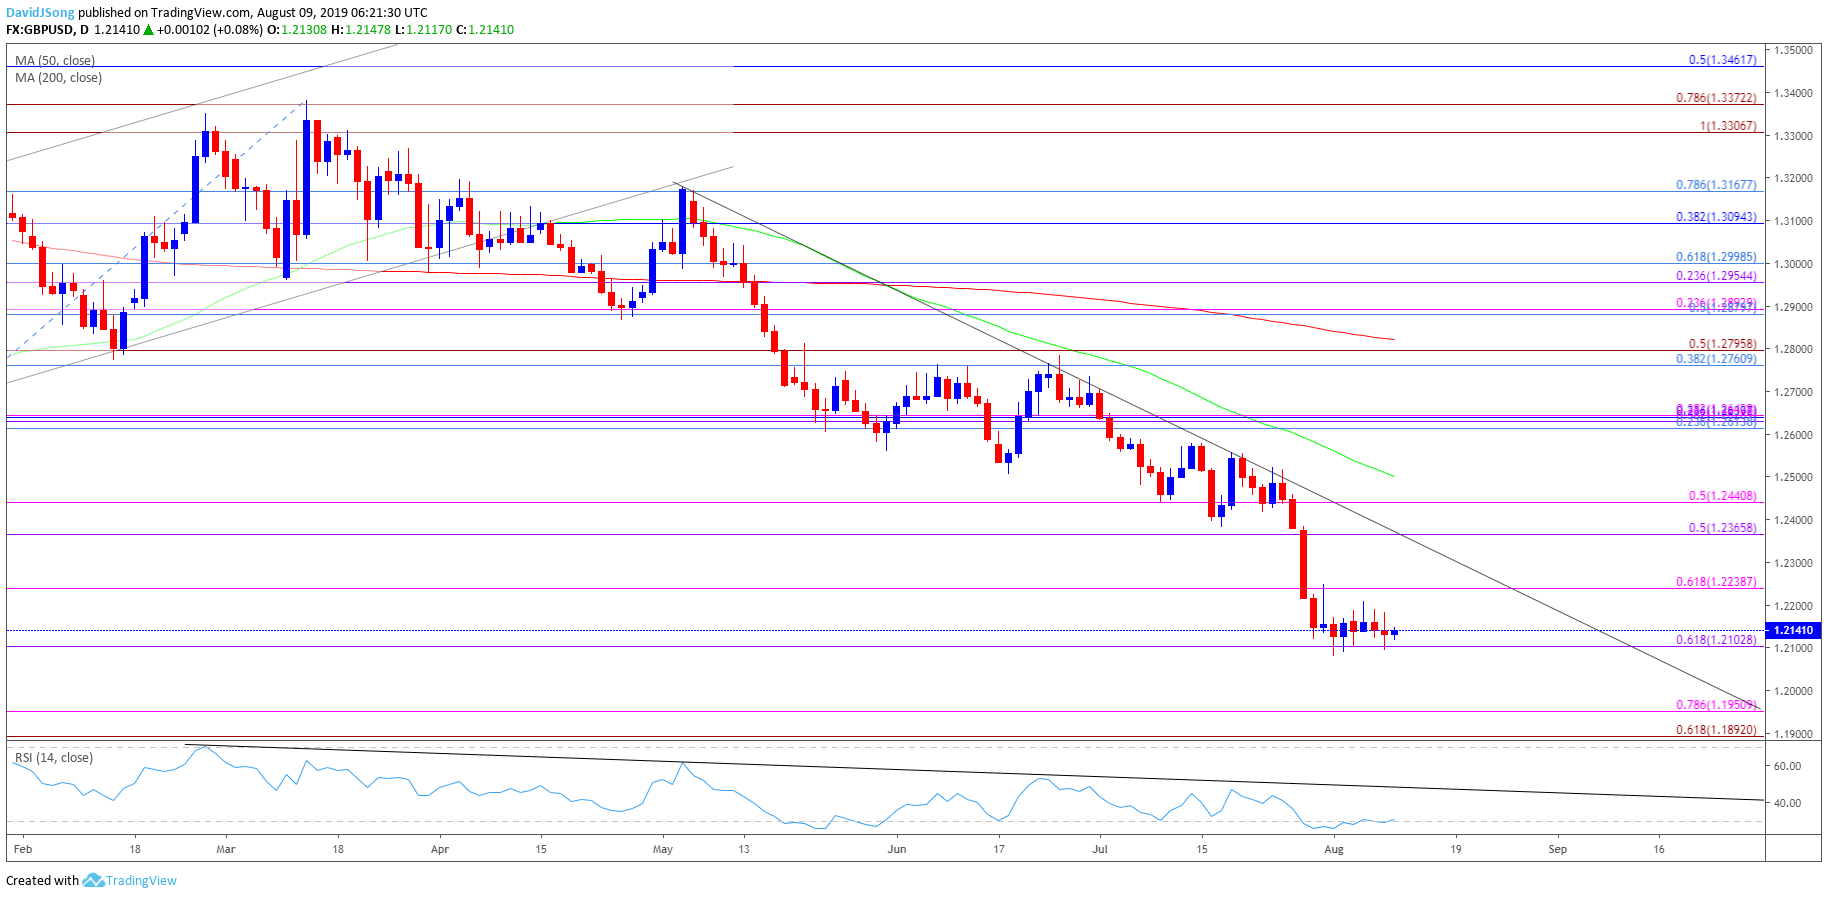
Source: Trading View
Keep in mind, the broader outlook for GBP/USD is no longer constructive as the exchange rate snaps the upward trend from late last year after failing to close above the Fibonacci overlap around 1.3310 (100% expansion) to 1.3370 (78.6% expansion).
However, the string of failed attempts to close below the 1.2100 (61.8% expansion) handle may generate a larger rebound in GBPUSD, with a break/close above the 1.2240 (61.8% expansion) region opening up the Fibonacci overlap around 1.2370 (50% expansion) to 1.2440 (50% expansion).
Will keep a close eye on the RSI as the oscillator appears to be flashing a textbook buy signal, with the move above 30 raising the risk for a larger rebound in GBPUSD as the oscillator bounces back from oversold territory.
Additional Trading Resources
For more in-depth analysis, check out the 3Q 2019 Forecast for GBP/USD
Are you looking to improve your trading approach? Review the ‘Traits of a Successful Trader’ series on how to effectively use leverage along with other best practices that any trader can follow.
Want to know what other currency pairs the DailyFX team is watching? Download and review the Top Trading Opportunities for 2019
— Written by David Song, Currency Strategist
Follow me on Twitter at @DavidJSong.