
Gold Price Talking Points
The price of gold consolidates ahead of the Federal Reserve meeting, but the failed attempt to test the monthly-low ($1459) may bring the topside targets back on the radar as a bull-flag formation takes shape.
Gold Price Forecast: Bull Flag on Radar Ahead of Fed Rate Decision
The Federal Open Market Committee (FOMC) may shake up the near-term outlook for gold as the central bank is widely expected to reduce the benchmark interest rate for the third time in 2019.
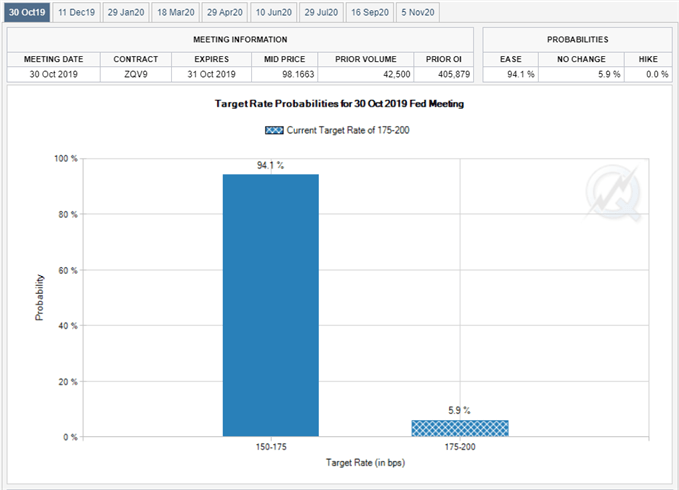
Fed Fund futures still show a greater than 90% probability for a 25bp rate cut on October 30, with the reduction likely to be accompanied by a cut in the interest rate for excess reserves.
The ongoing shift in US trade policy may push the FOMC to reverse the four rate-hikes from 2018 as “weakness in global growth and trade policy uncertainty haveweighed on the economy,” but it remains to be seen if Chairman Jerome Powell and Co. will further embark on its rate easing cycle as Fed officials see the benchmark interest rate around 1.50% to 1.75% through 2020.
In turn, market participants may pay increased attention to the forward guidance for an indication on whether Fed officials will project a lower trajectory for benchmark interest rate when they update the Summary of Economic Projections (SEP) at the next quarterly meeting in December.
However, the growing dissent within the FOMC may fuel fears of a policy error as the central bank makes an unexpected announcement to purchase US Treasury Bills in the secondary market, and falling interest rates along with signs of a global recession may heighten the appeal of gold as market participants look to hedge against fiat currencies.
With that said, the near-term outlook for gold remains mired by a head-and-shoulders formation, but a bull-flag appears to be taking shape following the failed attempt to test the monthly-low ($1459).
Sign up and join DailyFX Currency Strategist David Song LIVE for an opportunity to discuss potential trade setups.
Gold Price Daily Chart
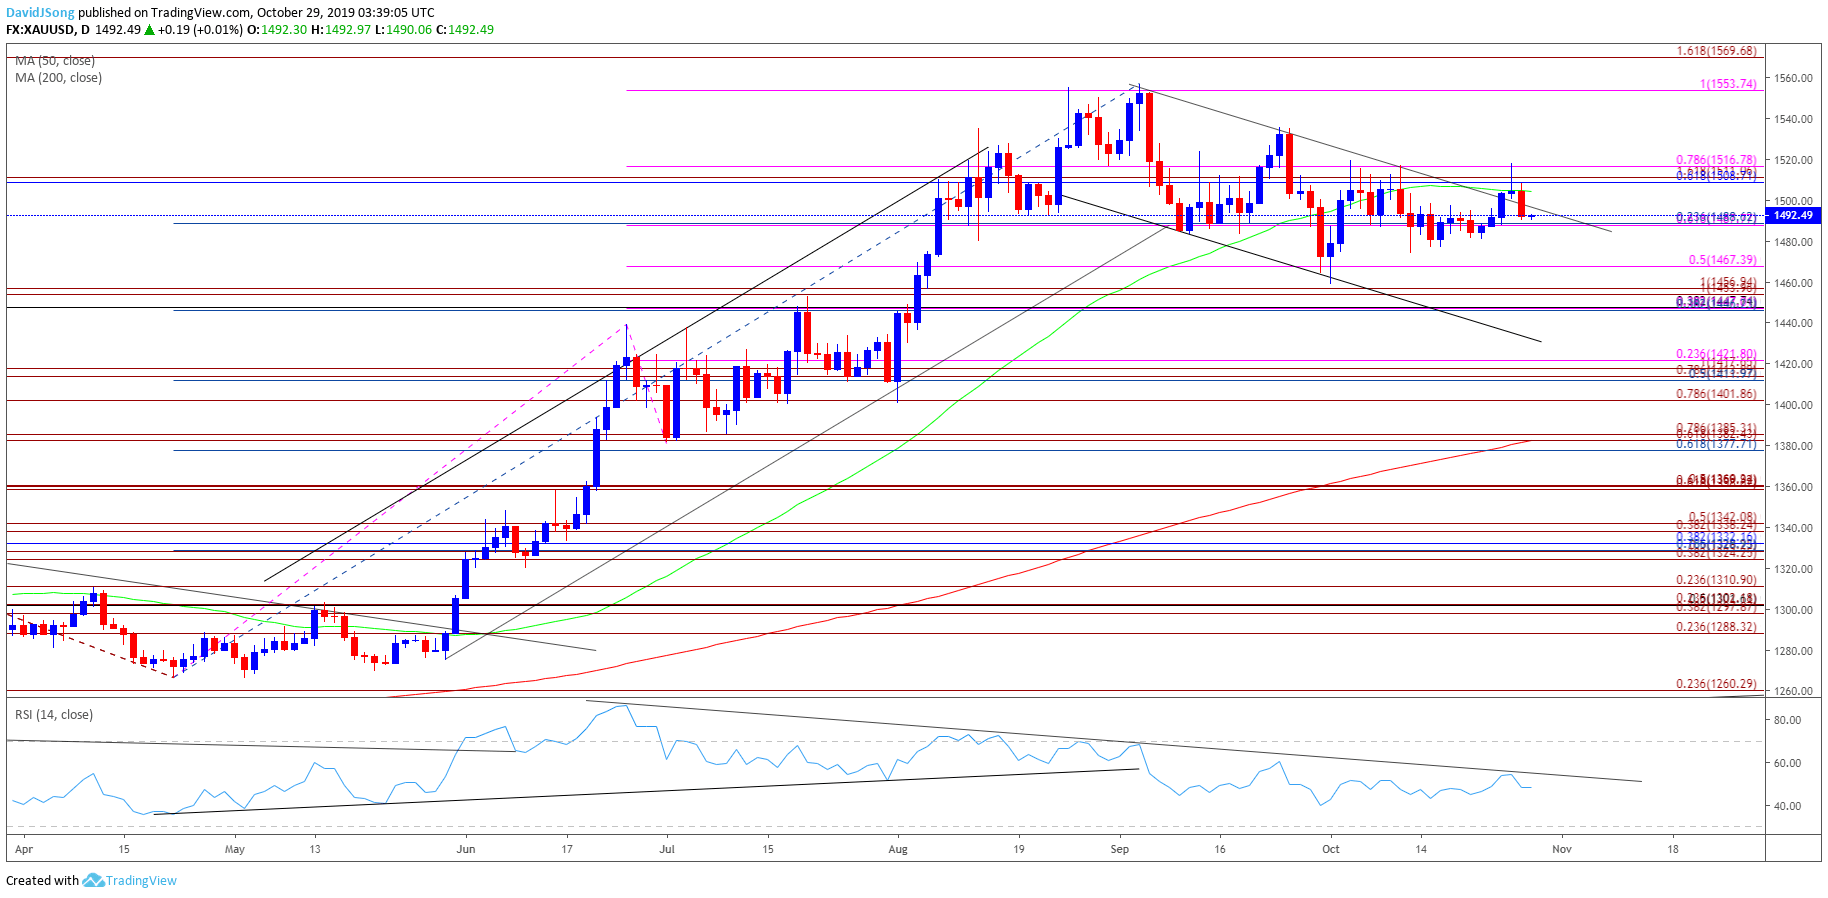
Source: Trading View
- The broader outlook for gold prices remain constructive as both price and the Relative Strength Index (RSI) clear the bearish trends from earlier this year, with the precious metal trading to a fresh yearly-high ($1557) in September.
- However, the RSI warns of a prolonged correction as the oscillator continues to track the downward trend from June, with gold still at risk of facing a head-and-shoulders top.
- The string of failed attempts to close above the Fibonacci overlap around $1509 (61.8% retracement) to $1517 (78.6% expansion) may produce range-bound conditions, but a bull-flag may continue to take shape as the price of gold preserves the monthly opening range.
- In turn, need the RSI to break out of the bearish formation to bring the topside targets back on the radar, with a close above the $1509 (61.8% retracement) to $1517 (78.6% expansion) region opening up the $1554 (100% expansion) area, which largely lines up with the 2019-high ($1557).
For more in-depth analysis, check out the 4Q 2019 Forecast for Gold
Additional Trading Resources
Are you looking to improve your trading approach? Review the ‘Traits of a Successful Trader’ series on how to effectively use leverage along with other best practices that any trader can follow.
Want to know what other currency pairs the DailyFX team is watching? Download and review the Top Trading Opportunities for 2019.
— Written by David Song, Currency Strategist
Follow me on Twitter at @DavidJSong.