Gold Price Talking Points
The price of gold appears to stuck in a narrow range ahead of the Federal Reserve’s last interest rate decision for 2019, but developments coming out of the US may sway the near-term outlook for the precious metal as the Trump administration prepares to raise China tariffs on December 15.
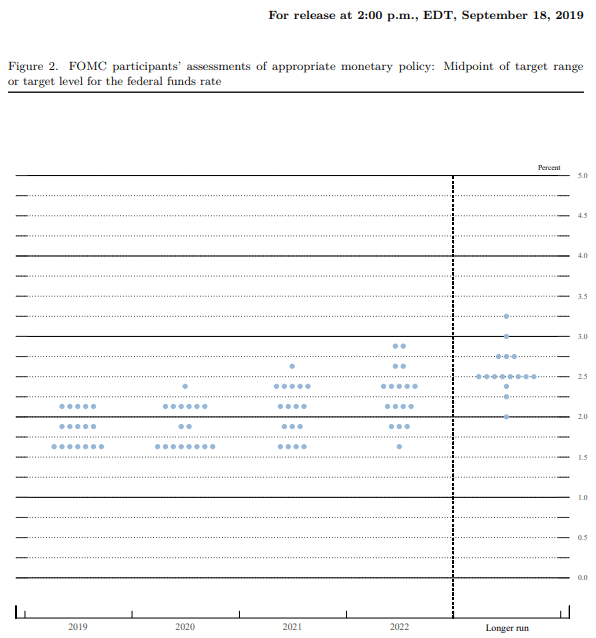
Gold Price Outlook Hinges on Fed’s Summary of Economic Projections
The price of gold may continue to track the monthly opening range over the coming days as the Federal Open Market Committee (FOMC) is widely expected to keep the benchmark interest rate in its current threshold of 1.50% to 1.75% ahead of 2020.
A pause in the FOMC’s rate easing cycle may produce a limited reaction as Fed Fund futures continue to show a grater than 90% probability the central bank will retain the current policy after delivering three consecutive rate cuts in 2019.
However, the updates to the Summary of Economic Projections (SEP) may influence the financial markets as market participants gauge the future path for monetary policy.

The Fed’s interest rate dot-plot is likely to get increased attention as Chairman Jerome Powell and Co. start to endorse a wait-and-see approach, and little to no changes in the forward guidance may drag on the price of gold as the central bank tames speculation for lower interest rates.
However, Fed officials may project a lower trajectory for the benchmark interest rate in response to the ongoing shift in US trade policy, and indications of a more accommodative stance may heighten the appeal of gold as the Trump administration struggles to reach a trade deal with China.
With that said, developments coming out of the US may sway the price of gold, but the reaction to the former-resistance zone around $1447 (38.2% expansion) to $1457 (100% expansion) helps to rule out the threat of a Head-and-Shoulders formation as the region appears to be acting as support.
Sign up and join DailyFX Currency Strategist David Song LIVE for an opportunity to discuss potential trade setups.
Gold Price Daily Chart
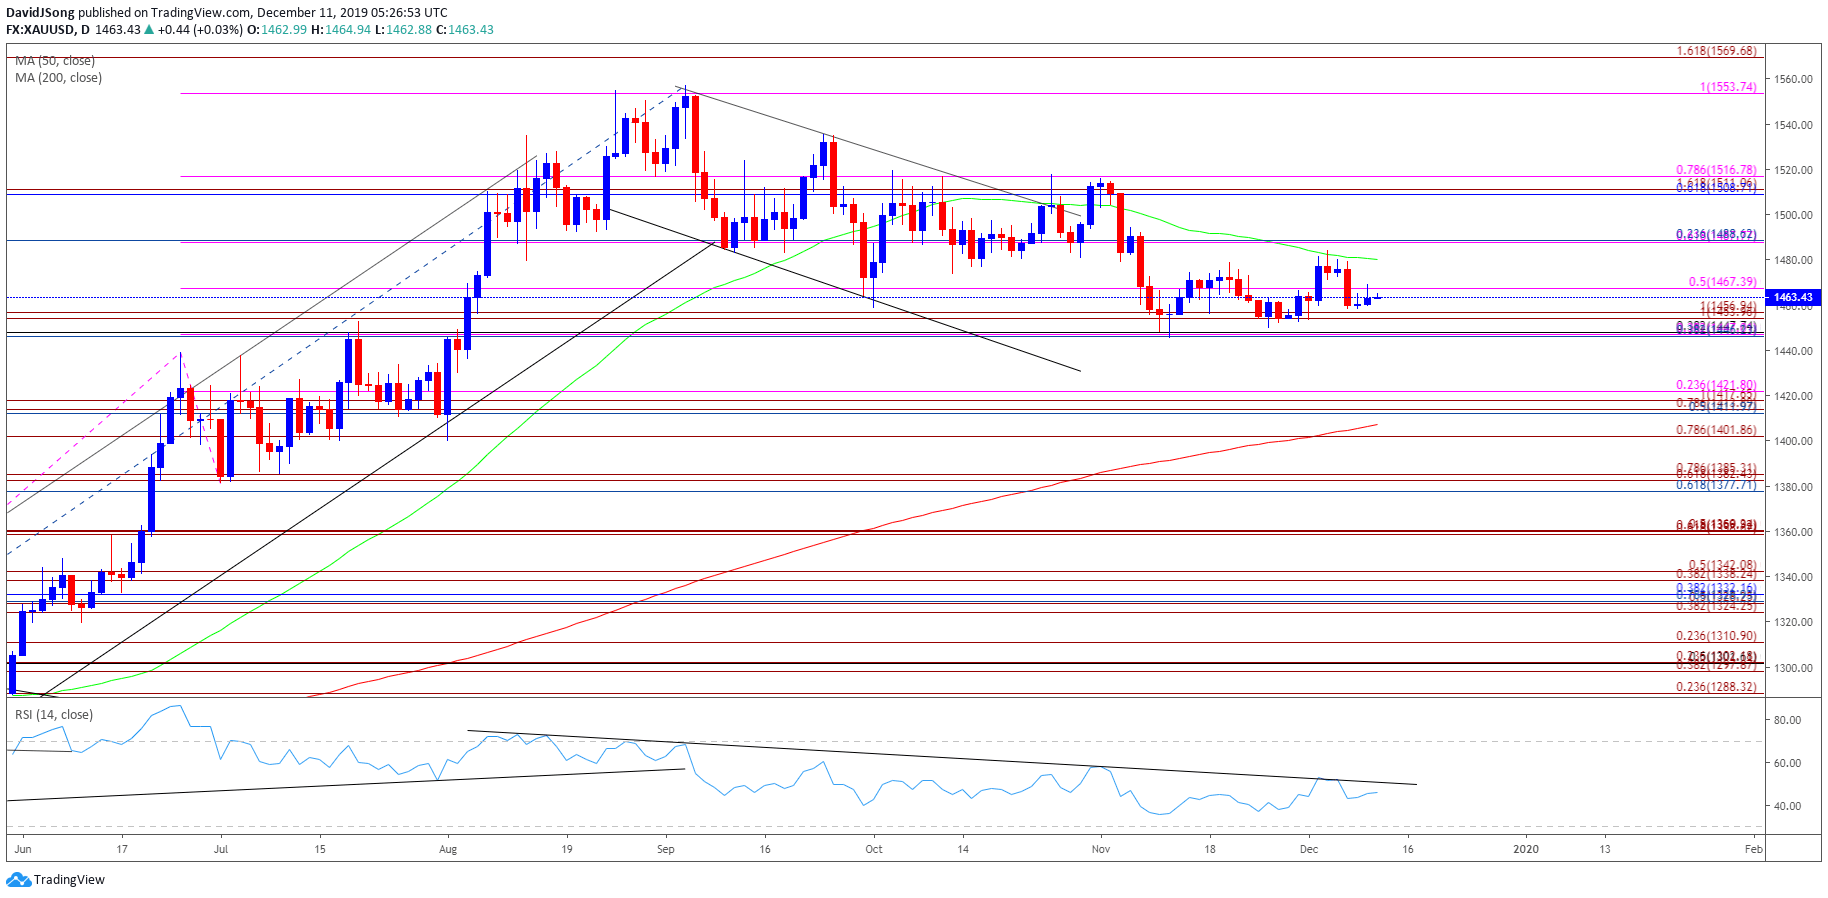
Source: Trading View
- Keep in mind, the broader outlook for gold prices remain constructive as both price and the Relative Strength Index (RSI) clear the bearish trends from earlier this year, with the precious metal trading to a fresh yearly-high ($1557) in September.
- Moreover, the reaction to the Fibonacci overlap around $1447 (38.2% expansion) to $1457 (100% expansion) helps to rule out the threat of a Head-and-Shoulders formation as the former-resistance zone appears to be acting as support.
- However, the near-term correction in the price for gold has been accompanied by a bearish formation in the RSI, with the pattern offering a mixed signal as a bull flag formation also takes shape.
- In turn, gold may largely track the November range, with a move above $1489 (23.6% retracement) bringing last month’s high ($1516) on the radar.
- Need a break/close above the $1509 (61.8% retracement) to $1517 (78.6% expansion) region to bring the topside targets on the radar, with the first hurdle coming in around $1554 (100% expansion), which largely lines up with the yearly-high ($1557).
For more in-depth analysis, check out the 4Q 2019 Forecast for Gold
Additional Trading Resources
Are you looking to improve your trading approach? Review the ‘Traits of a Successful Trader’ series on how to effectively use leverage along with other best practices that any trader can follow.
Want to know what other currency pairs the DailyFX team is watching? Download and review the Top Trading Opportunities for 2019.
— Written by David Song, Currency Strategist
Follow me on Twitter at @DavidJSong.