Gold Price Talking Points:
– Gold prices have continued to work within the confines of a symmetrical wedge pattern, with both the support and resistance side of the formation coming into play over the past week.
– Last week saw a support trend-line tested with bulls showing up around the prior 2019 swing low, taken from around 1266.10. But, as looked at in this week’s technical forecast, a failure from bears to breakout there kept the door open for bullish strategies. After a gap-fill pullback to start this week, Gold prices rallied up to test the resistance side of the formation, which is currently helping to set the three-week-high in Gold prices.
– DailyFX Forecasts are published on a variety of currencies such as Gold, the US Dollar or the Euroand are available from the DailyFX Trading Guides page. If you’re looking to improve your trading approach, check out Traits of Successful Traders. And if you’re looking for an introductory primer to the Forex market, check out our New to FX Guide.
Do you want to see how retail traders are currently trading Gold? Check out our IG Client Sentiment Indicator.
Gold Price Softens After Fresh Three-Week-High
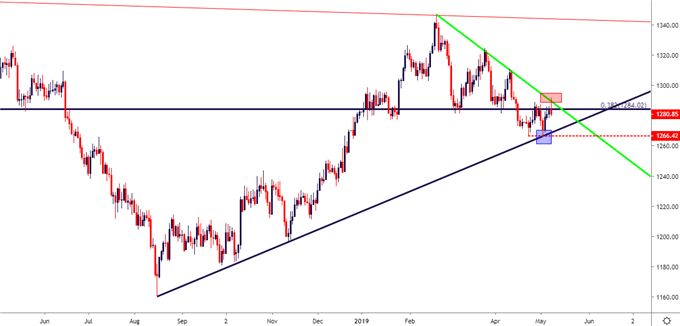
Gold prices remain on the move following last week’s failed breakout at 2019 lows. As looked at in this week’s Technical Forecast for Gold prices, the yellow metal put in a pattern of retracement over the prior couple of months, giving back gains from the August-February bullish run. Gold prices soon found trend-line support, as taken from the August and November swing-lows from last year; and that level helped to cauterize support last week as buyers began to show-up.
Gold Price Daily Chart
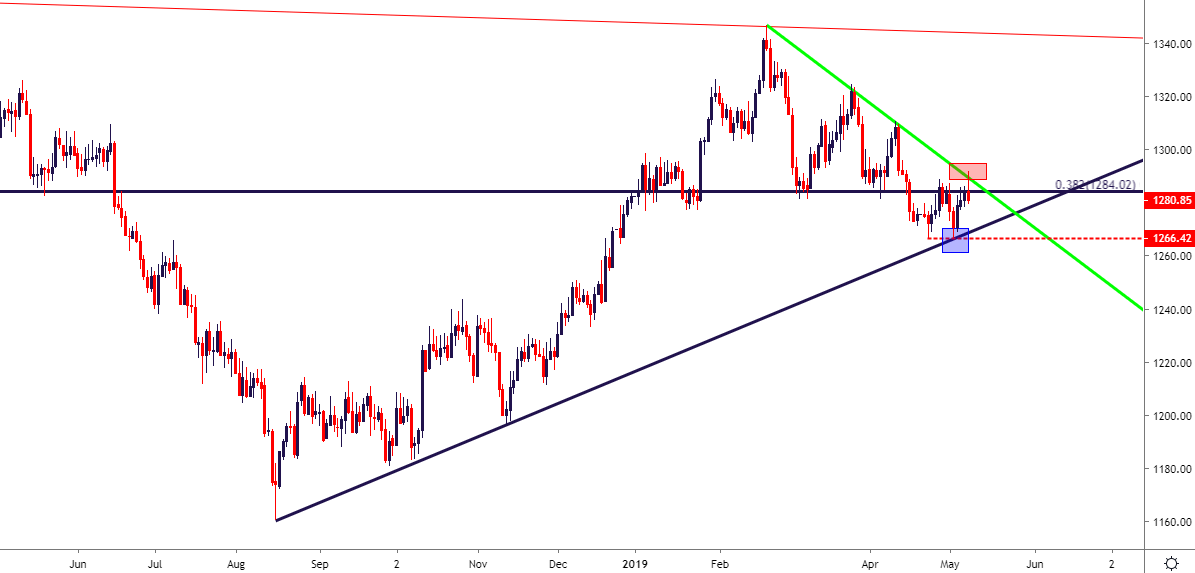
Chart prepared by James Stanley
As looked at shortly after this week’s open, that bullish stance in Gold prices remained workable after the weekend gap was filled. That took place in short order, and as pressure around risk aversion themes continued to show in the early-portion of this week, Gold prices held that support and began to rally. That move extended up to fresh three-week-highs as of this morning; but that’s around the time that another trend-line came into play. This was a bearish trend-line drawn from the February and April swing-highs, and this produced a rather clear change in short-term price action as bulls pulled back from the throttle and prices sank right back down to the 1280.50 level.
Gold Price Four-Hour Chart
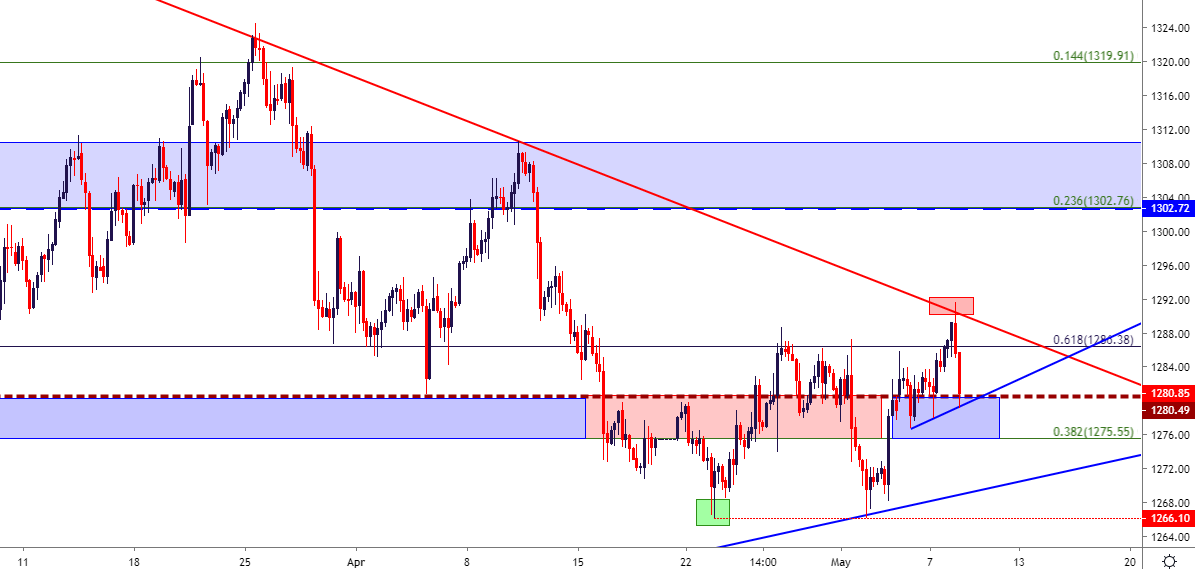
Chart prepared by James Stanley
At this stage, Gold prices remain in a state of digestion given that trend-line inflections over the past week have governed both the sell-off and the advance. But, as written in this week’s forecast, there’s a case of digestion taking place within a longer-term case of digestion; the type of backdrop that could lead into very large moves, in one direction or the other. At this stage, the bullish side of Gold prices can remain as attractive, and taken from short-term charts, that theme remains workable as there is an element of support showing at a familiar level that had previously set resistance.
The level of 1280.50 was the March swing low in Gold prices, and the initial re-test there in early-March led to a move that saw a $45 rally. This same level came into play in early-April, leading to a $30 bounce. This price was finally broken-thru in mid-April; but bears were setting support around 1266 a week later, and this level still stands as the yearly low in Gold prices.
Gold Price Two-Hour Price Chart
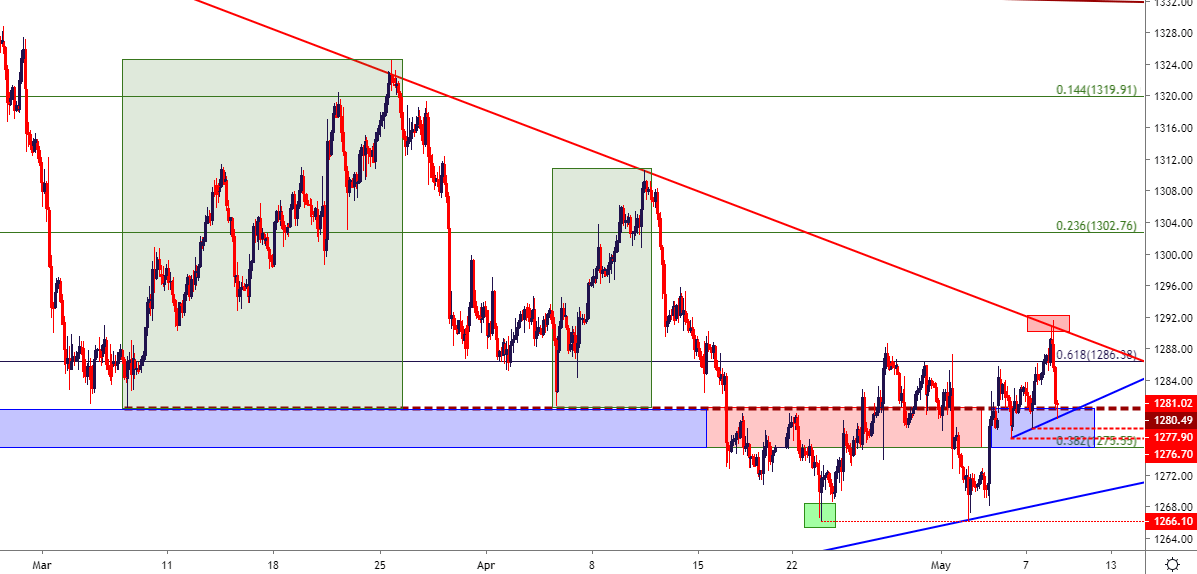
Chart prepared by James Stanley
Gold Price Strategy
At this stage, given the higher-lows that have shown up so far this week along with the higher-high from this morning, and the door can remain open for short-term themes of strength in Gold. Traders can watch the support zone that runs from 1275.55 for support signals, metering aggressiveness based on how and where bulls respond here. If we do see respect of the higher-lows this week, as indicated by a hold above yesterday’s swing around the 1278 handle, topside continuation with a re-test of those highs will appear attractive. If price action does dig inside of yesterday’s low, the topside momentum theme won’t be as attractive, but it still can remain workable for those so inclined. The key there would appear to be a hold above 1275.55, which is the 38.2% Fibonacci retracement of the August-February major move. If prices cannot hold above that level, then the 1266 low is exposed for a re-test and, perhaps even a bearish break upon a third test.
Gold Price Hourly Chart
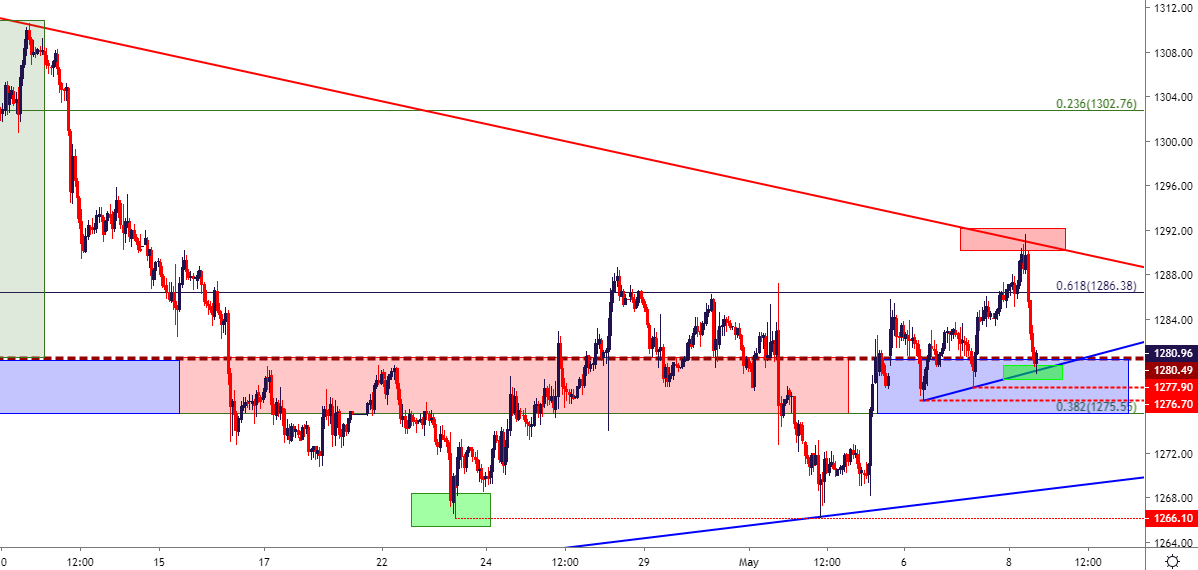
Chart prepared by James Stanley
To read more:
Are you looking for longer-term analysis on the U.S. Dollar? Our DailyFX Forecasts have a section for each major currency, and we also offer a plethora of resources on Gold or USD-pairs such as EUR/USD, GBP/USD, USD/JPY, AUD/USD. Traders can also stay up with near-term positioning via our IG Client Sentiment Indicator.
Forex Trading Resources
DailyFX offers an abundance of tools, indicators and resources to help traders. For those looking for trading ideas, our IG Client Sentiment shows the positioning of retail traders with actual live trades and positions. Our trading guides bring our DailyFX Quarterly Forecasts and our Top Trading Opportunities; and our real-time news feed has intra-day interactions from the DailyFX team. And if you’re looking for real-time analysis, our DailyFX Webinars offer numerous sessions each week in which you can see how and why we’re looking at what we’re looking at.
If you’re looking for educational information, our New to FX guide is there to help new(er) traders while our Traits of Successful Traders research is built to help sharpen the skill set by focusing on risk and trade management.
— Written by James Stanley, Strategist for DailyFX.com
Contact and follow James on Twitter: @JStanleyFX