Gold Price Weekly Outlook Talking Points:
Gold Technical Forecast: Bullish
Gold Prices Break out to Fresh Five-Year-Highs
Last week brought a familiar scenario into the mix. Gold prices held resistance at a key area on the chart after what had become a strong two-week-run. Price action showed a long-legged doji on the weekly chart, often indicative of indecision and when printing on the top of a trend, something that may open the door for bearish reversal potential. And this even showed up at a precarious area on the chart, as that batch of resistance had held the highs through many similar themes over the past five years.
But this week – this week was unlike any of those instances in the past five years as Gold bulls were finally able to stampede through that resistance. For the first time since 2013, Gold prices traded above the 1400 level; marking a significant move from the support that showed just three weeks ago around the 1275-area.
I had highlighted this breakout potential in early-May, and then again later in the month just before the breakout took place as a case of congestion-inside-of-congestion had shown.
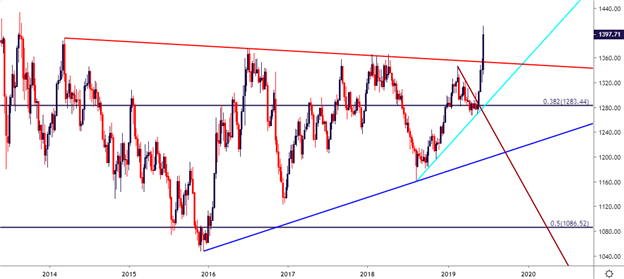
Gold Price Weekly Chart: Resolution of Congestion

Gold Goes ‘Boom’ – Can it Continue?
This week saw Gold prices take-out a number of notable levels and given the events in the headlines there was more than adequate reason to explain why this happened. Also given the dovish shift at the Fed and the fact that pretty much all large, global Central Banks are harboring some form of dovish posture, it makes sense that there could be further aim for continuation. The big-picture bullish trend in Gold that ran from the Financial Collapse into 2011 syncs well with a similar theme, as Global Central Banks all held a dovish, bearish backdrop at the time. Now that we’re seeing the same type of scenario, there could certainly be additional topside to show.
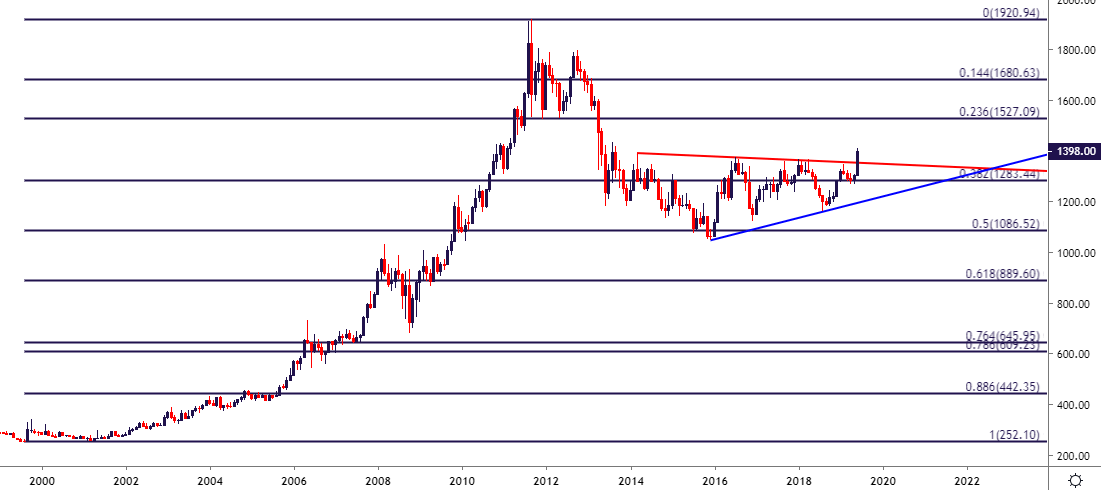
Taking a step back in order to get a bigger-picture look on the matter, and there could be considerable aim for continuation. That 1999-2011 topside run posed an approximate 50% pullback in the eight years since the high was set; but after support showed up in February of 2016, Gold prices spent much of the time since in some form of consolidation. Until this month, that is.
That consolidation has now given way to the prior theme of strength that ran so clearly into 2011.
Gold Price Monthly Chart
Gold Price Strategy for Next Week
Given the strength of the recent move and the context with which this has happened, it could be difficult to justify short-side stances in the yellow metal at the moment. On the opposite end of the spectrum, prices are so far stretched from any nearby points of support that bullish trend strategies could be of challenge, as well. Nonetheless, given the significance of the move and the catalyst that led into it, the technical forecast for Gold will be set to bullish for the week ahead.
Below, I look at a series of prior resistance points. Each of these retains some element of value for support potential in the effort of working with pullbacks. Additionally, I’ve marked a couple of topside levels that could remain of interest on the target side of the equation; namely, the 1433.85 level that came into play as the September 2013 swing-high, along with the 1483.74 level that marks the 50% level of the 2011-2015 pullback. Also of potential interest is a level at 1461.93, which is the 61.8% Fibonacci extension of the prior near-term major move. The 27.2% extension of that same study is currently coming in to help hold weekly resistance.
Gold Price Weekly Chart

Chart prepared by James Stanley
To read more:
Are you looking for longer-term analysis on the U.S. Dollar? Our DailyFX Forecasts have a section for each major currency, and we also offer a plethora of resources on Gold or USD-pairs such as EUR/USD, GBP/USD, USD/JPY, AUD/USD. Traders can also stay up with near-term positioning via our IG Client Sentiment Indicator.
Forex Trading Resources
DailyFX offers an abundance of tools, indicators and resources to help traders. For those looking for trading ideas, our IG Client Sentiment shows the positioning of retail traders with actual live trades and positions. Our trading guides bring our DailyFX Quarterly Forecasts and our Top Trading Opportunities; and our real-time news feed has intra-day interactions from the DailyFX team. And if you’re looking for real-time analysis, our DailyFX Webinars offer numerous sessions each week in which you can see how and why we’re looking at what we’re looking at.
If you’re looking for educational information, our New to FX guide is there to help new(er) traders while our Traits of Successful Traders research is built to help sharpen the skill set by focusing on risk and trade management.
— Written by James Stanley, Strategist for DailyFX.com
Contact and follow James on Twitter: @JStanleyFX