
NZD CURRENCY VOLATILITY – TALKING POINTS
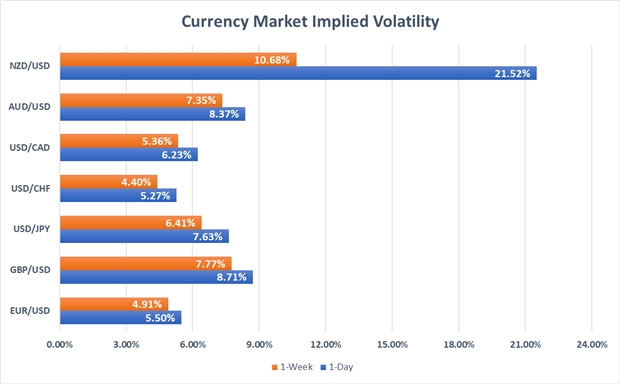
According to surging NZDUSD overnight implied volatility – which now sits at 21.5 percent – spot prices are expected to be the most active since August 2016. The latest rip higher in the US Dollar in response to a relatively hawkish tilt from the Fed meeting last week has been exacerbated by recent weakness in comparably ‘riskier’ currencies like the New Zealand Dollar.
Meanwhile, soft NZ economic data and dovish commentary from the Reserve Bank of New Zealand (RBNZ) has led to OIS futures pricing a 40 percent chance that the central bank lowers its Overnight Cash Rate (OCR) by 25 basis points tomorrow which currently stands at 1.75 percent.
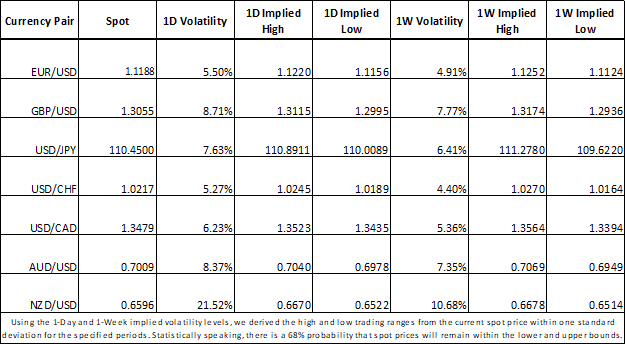
FOREX MARKET IMPLIED VOLATILITY AND TRADING RANGES
Looking to other NZD currency crosses, forex traders might shift their focus to AUDNZD or NZDJPY seeing that their overnight implied volatility measures have also skyrocketed to their highest levels since October 2017 and November 2016 respectively. In the wake of the RBA, AUDNZD could see further price swings with the RBNZ’s now looking to stir volatility with its latest decision on rates.
AUDNZD PRICE CHART: 4-HOUR TIME FRAME (APRIL 10, 2019 TO MAY 07, 2019)
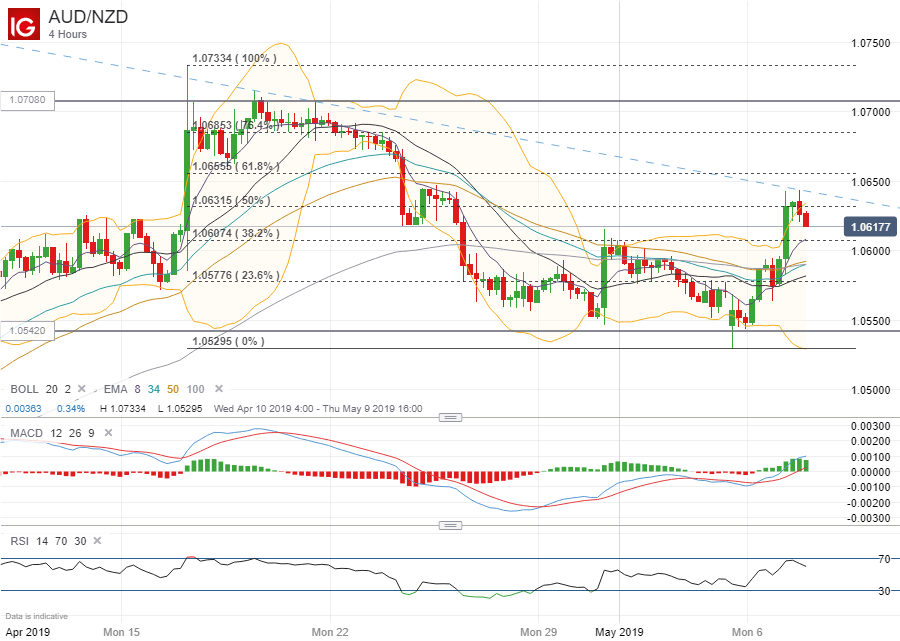
With an implied volatility of 14.91 percent, AUDNZD might be expected to trade between 1.0542 and 1.0708 with a 68 percent statistical probability. This 1 standard deviation band away from spot prices roughly aligns with its 1 month trading range. However, downtrend resistance appears where today’s gain in the Aussie halted. If RBNZ cuts rates tomorrow, AUDNZD could quickly break through this level and potentially target the 1.07 handle.
Conversely, a firm RBNZ may likely reverse recent advances in the currency pair. Also, language from Governor Orr is expected to provide context of the central bank’s relatively hawkish or dovish position which traders will contrast to the latest RBA decision.
NZDJPY PRICE CHART: DAILY TIME FRAME (OCTOBER 24, 2018 TO MAY 07, 2019)

The New Zealand Dollar has come under considerable downward pressure recently – particularly against the Japanese Yen. The latest bit of weakness in the Kiwi could be attributed to the flareup in trade tension between the US and China seeing that China is the biggest importer of New Zealand’s goods. This escalation in trade wars from Trump’s tariffs could potentially be labeled as a contributing factor to the RBNZ’s decision if the central bank does in fact lower its OCR tomorrow, which will likely weigh on the NZD.
That being said, currency traders could expect NZDJPY to trade between 71.836 and 73.673 tomorrow – with the RBNZ likely dictating the direction of price action – as calculated from overnight implied volatility of 24.1 percent with a 68 percent statistical probability. If RBNZ stands pat on rates, NZDJPY could retest resistance at the 38.2 percent Fibonacci retracement line drawn from the high in December 2018 and JPY flash crash low in January earlier this year. On the other hand, a dovish RBNZ might send NZDJPY to the 72.000 handle where the 23.6 percent Fibonacci line could provide a level of support.
TRADING RESOURCES
Whether you are a new or experienced trader, DailyFX has multiple resources available to help you: an indicator for monitoring trader sentiment; quarterly trading forecasts; analytical and educational webinars held daily; trading guides to help you improve trading performance, and even one for those who are new to FX trading.
– Written by Rich Dvorak, Junior Analyst for DailyFX
– Follow @RichDvorakFX on Twitter