
Crude Oil Price Talking Points
Oil pulls back from a fresh monthly-low ($62.99) following an unexpected jump in U.S. Crude Inventories, but current market conditions may keep oil prices afloat as the Relative Strength Index (RSI) sits in overbought territory.
Oil Forecast Clouded by Overbought Signal, Jump in Crude Inventories
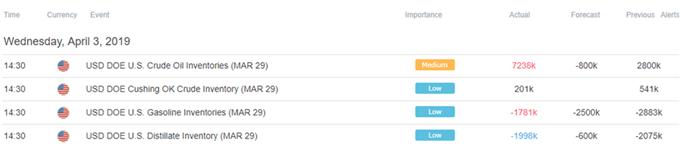
Oil struggles to extend the advance from earlier this week as U.S. Crude Inventories increased for the second consecutive week, with stockpiles expanding another 7,238K after climbing 2,800K in the week ending March 22.
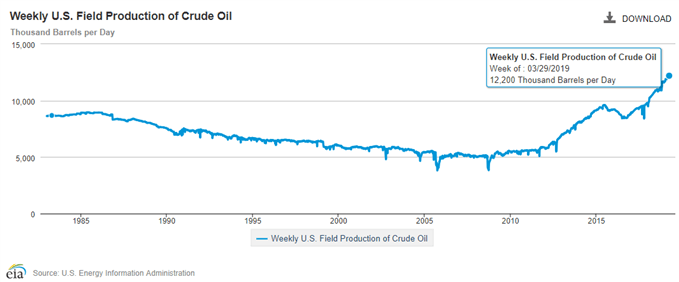
At the same time, updates from the U.S. Energy Information Administration (EIA) showed weekly field production of crude oil climbing to a fresh record of 12,200K b/d in the week ending March 29, and the developments may push the Organization of the Petroleum Exporting Countries (OPEC) and its allies to regulate the energy market throughout 2019 as the group plans to hold a tentative Joint Ministerial Monitory Committee (JMMC) meeting on May 19.
Fresh remarks from OPEC Secretary General Mohammad Barkindo suggest the group and its allies are in no rush to boost production as the ‘Declaration of Cooperation’ has helped to ‘return balance to the market and reintroduced a long-absent element of stability,’ but U.S. President Donald Trump may continue to respond to higher energy prices as he tweets ‘world markets are fragile, price of oil getting too high.’
With that said, it remains to be seen if OPEC and its allies will curb production beyond the June deadline as the most recent Monthly Oil Market Report (MOMR) notes that ‘world oil demand is forecast to grow by 1.24 mb/d, unchanged from last month’s projections,’ but the current market conditions keep the topside targets on the radar as both price and the Relative Strength Index (RSI) extends the bullish formations from late-2018. Moreover, recent developments in the RSI suggest the bullish momentum is gathering pace as the oscillator breaks above 70 and sits in overbought territory for the first time this year.
CL1 Daily Chart

- Crude extends the advance from the 2018-low ($42.36) following the failed attempt to close below the $55.10 (61.8% expansion) to $55.60 (61.8% retracement) area, with the price for oil coming up against the Fibonacci overlap around $62.70 (61.8% retracement) to $63.70 (38.2% retracement).
- Need a break/close above the overlap to bring the $64.90 (100% expansion) to $65.90 (78.6% retracement) area on the radar, with the next topside region of interest coming in around $68.80 (23.6% retracement) to $69.20 (50% retracement).
- Will keep a close eye on the RSI as it sits in overbought territory, but may see a textbook sell-signal emerge should the oscillator fall below 70, which may spur a move back towards the $59.00 (61.8% retracement) to $59.70 (50% retracement) area.
Sign up and join DailyFX Currency Analyst David Song LIVE for an opportunity to discuss potential trade setups.
For more in-depth analysis, check out the 2Q 2019 Forecast for Oil
Additional Trading Resources
Are you looking to improve your trading approach? Review the ‘Traits of a Successful Trader’ series on how to effectively use leverage along with other best practices that any trader can follow.
Want to know what other markets the DailyFX team is watching? Download and review the Top Trading Opportunities for 2019.
— Written by David Song, Currency Analyst
Follow me on Twitter at @DavidJSong.