
Oil Talking Points
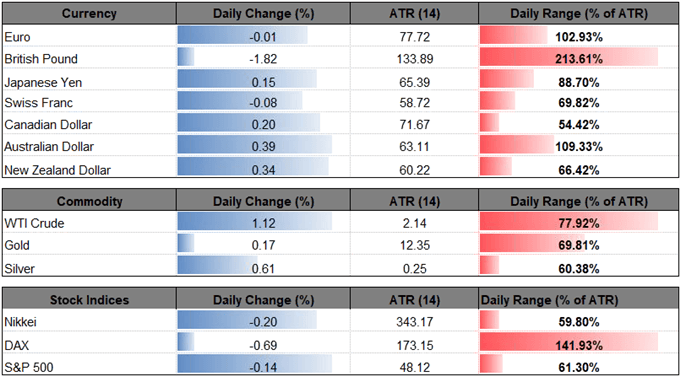
Oil prices have finally recovered from a record losing–streak as United Arab Emirates Energy Minister Suhail Al Mazrouei vows to ‘to cut production to keep the market balanced,’ but there seems to be a broader shift in trading behavior, with energy prices vulnerable to further losses as long as the Relative Strength Index (RSI) holds in oversold territory.
Oil Price RSI Sits in Oversold Territory Even as UAE Vows to Cut Output

It seems as though the Organization of the Petroleum Exporting Countries (OPEC) and its allies will continue to respond to the sharp decline in crude prices as Russia’s President,Vladimir Putin, favors oil ‘somewhere around $70.’ and the group may take further steps to keep energy prices afloat at the next meeting on December 6 as Saudi Arabia now plans to reduce exports by 500K b/d.
With OPEC now abandoning the ‘produce as much you can mode,’ the recent experience suggests the group will retain a proactive approach in 2019 as suppliers attempt to stabilize energy prices, but the pickup in volatility appears to be fueling a broader change in market behavior amid the ongoing shift in retail interest.
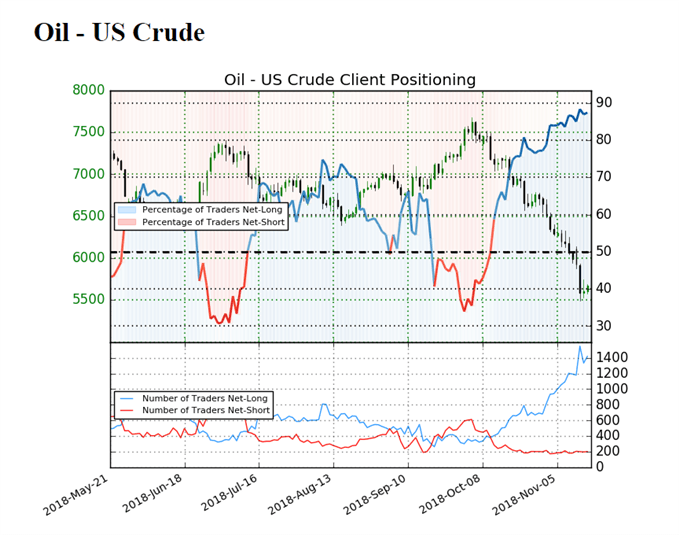
The IG Client Sentiment Report shows whopping 87.4% of traders are net-long crude, which compares to 82.6% during the previous week, with the ratio of traders long to short at 6.91 to 1.In fact, traders have been net-long since October 11 when oil traded near the $71.00 mark even though price has moved23.1% lower since then. The number of traders net-long is 10.7% lower than yesterday and 27.2% higher from last week, while the number of traders net-short is 5.1% higher than yesterday and 5.5% lower from last week.
The ongoing accumulation in net-long interest provides a contrarian view to crowd sentiment as traders seem to be betting on a larger recovery, and crude may face a more bearish fate going into 2019 as it snaps the upward trend from earlier this year. At the same time, the stickiness in the Relative Strength Index (RSI) warns of further losses as the momentum indicator sits in oversold territory, but the oscillator may flash a bullish signal over the coming days as it breaks out of the downward trend carried over from October. Sign up and join DailyFX Currency Analyst David Song LIVE for an opportunity to discuss potential trade setups.
Oil Daily Chart
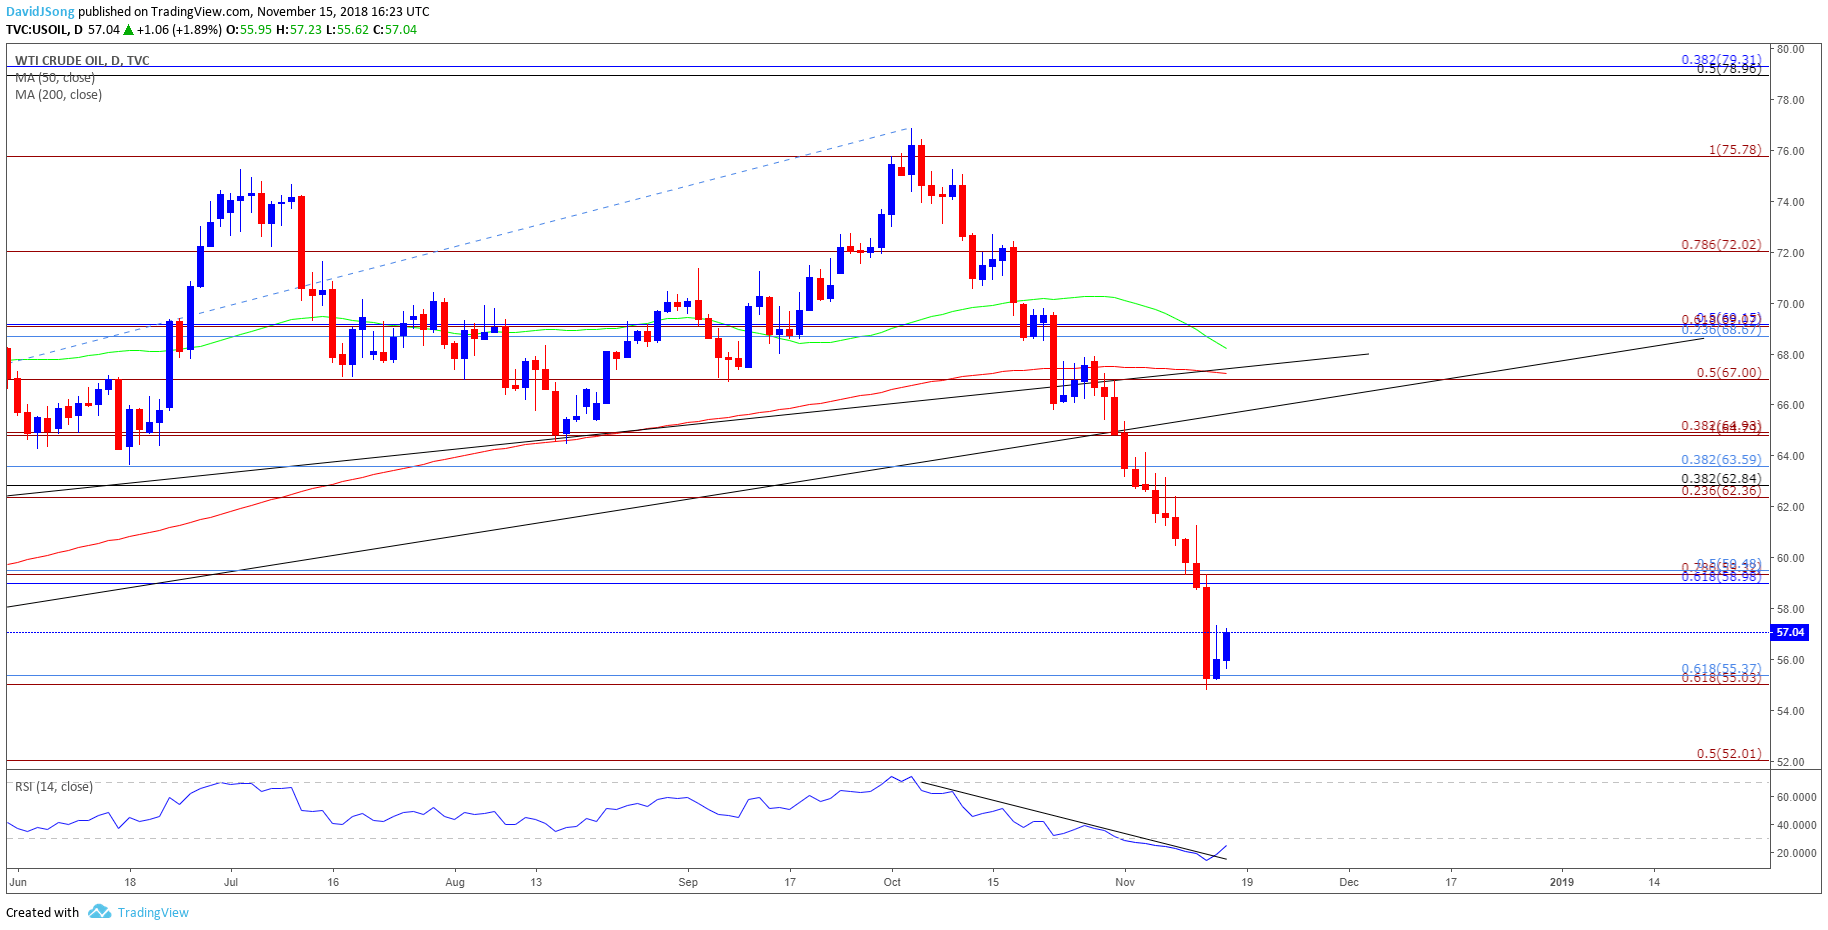
- Broader outlook for crude remains tilted to the downside as oil prices tumble to a fresh yearly-low ($54.79), with a break/close below the $55.00 (61.8% expansion) to $55.30 (61.8% retracement) region raising the risk for a move towards the $52.00 (50% expansion) handle.
- However, the recent series of higher lows may generate a larger rebound in crude especially as the RSI bounces back from an extreme reading, with the first region of interest coming in around $59.00 (61.8% retracement) to $59.30 (78.6% expansion) followed by the Fibonacci overlap around $62.40 (23.6% expansion) to $63.60 (38.2% retracement).
For more in-depth analysis, check out the Q4 Forecast for Oil
Additional Trading Resources
Are you looking to improve your trading approach? Review the ‘Traits of a Successful Trader’ series on how to effectively use leverage along with other best practices that any trader can follow.
Want to know what other currency pairs the DailyFX team is watching? Download and review the Top Trading Opportunities for 2018.
— Written by David Song, Currency Analyst
Follow me on Twitter at @DavidJSong.