
Oil Talking Points
Crude is back under pressure as there appears to be a rift between the Organization of the Petroleum Exporting Countries (OPEC) and its allies, and the current environment may continue to weigh on oil prices as the Relative Strength Index (RSI) struggles to recover from oversold territory.
Oil Rebound Fizzles Amid OPEC Uncertainty, RSI Stuck in Oversold Zone

It seems as though Russia will resist calls from the United Arab Emirates ‘to cut production’ as Alexander Novak, the Minister of Energy of the Russian Federation, wants to ‘see how the situation develops in November and early December to better understand both the current conditions and the winter outlook.’
The remarks put increased emphasis on the next meeting slated for December 6 as OPEC largely abandons the ‘produce as much you can mode,’ and the group may ultimately convince its allies to follow suit especially as International Energy Agency (EIA) Executive Director Fatih Birol announces that ‘currently markets are very well supplied.’ Until there’s an official response, the weakness in oil prices may continue to fuel a broader change in market behavior amid the ongoing tilt in retail interest.
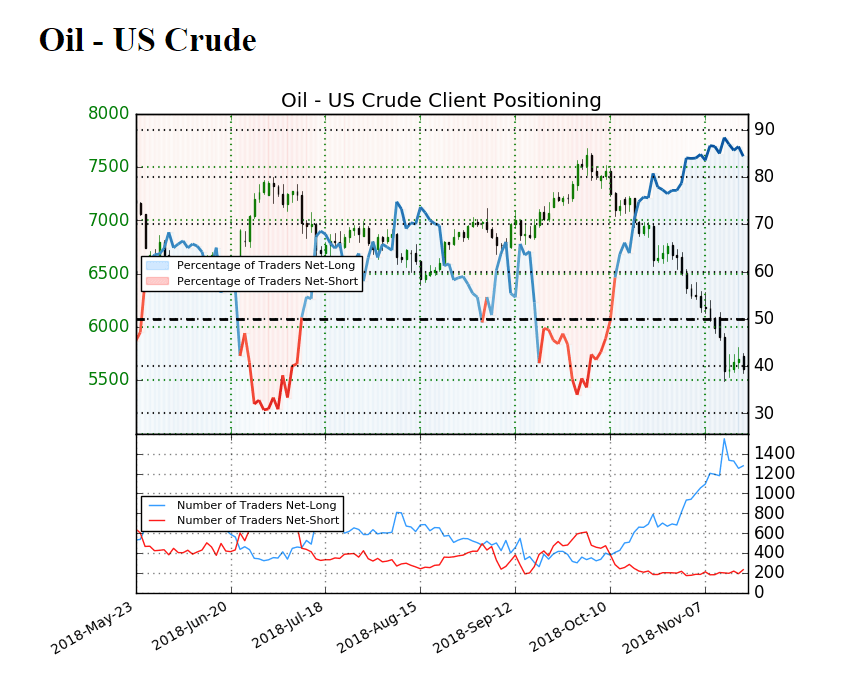
The IG Client Sentiment Report shows 84.3% of traders are still net-long crude compared to 87.4% last week, with the ratio of traders long to short at 5.39 to 1. Keep in mind, traders have been net-long since October 11 when oil traded near the $71.00 mark even though price has moved24.4% lower since then. The number of traders net-long is 0.9% lower than yesterday and 4.0% higher from last week, while the number of traders net-short is 0.4% higher than yesterday and 10.7% higher from last week.
Despite the rise in net-short position, the ongoing accumulation in net-long interest provides a contrarian view to crowd sentiment as traders seem to be betting on a larger recovery. However, crude may face a more bearish fate going into 2019 as it snaps the upward trend from earlier this year, with the Relative Strength Index (RSI) warning of a similar dynamic as the oscillator stubbornly sits in oversold territory. Sign up and join DailyFX Currency Analyst David Song LIVE for an opportunity to discuss potential trade setups.
Oil Daily Chart
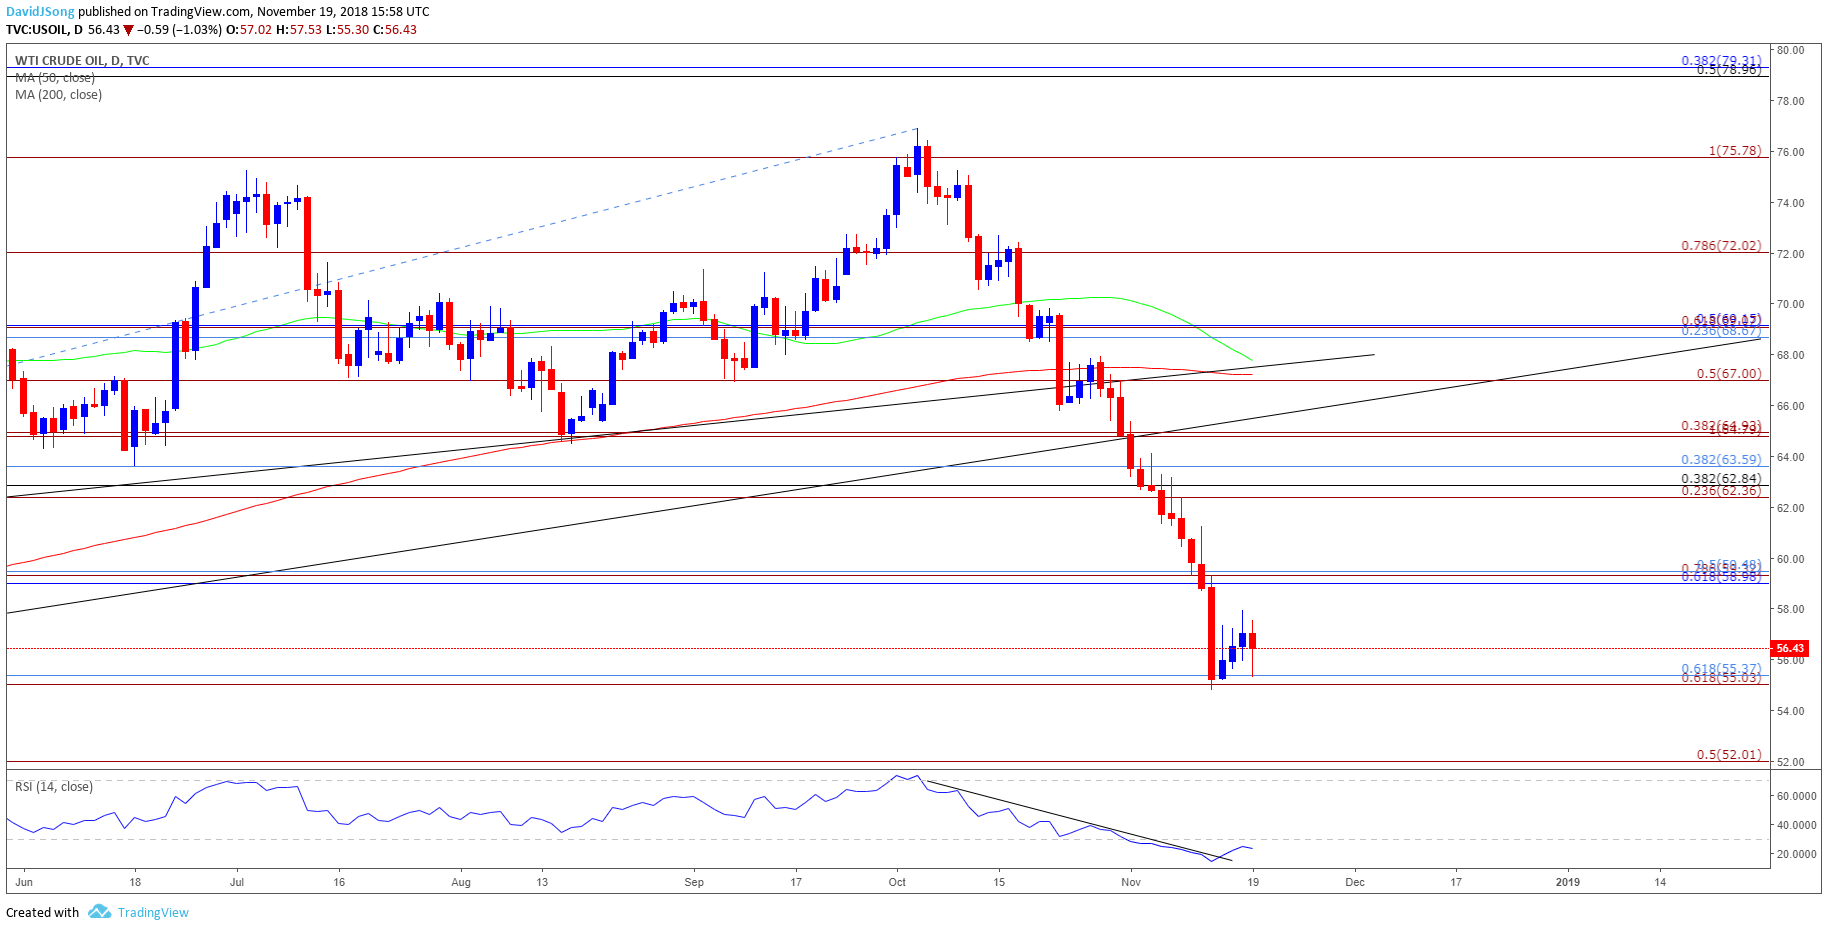
- Broader outlook for crude remains tilted to the downside, with oil at risk of extending the decline from earlier this month as it snaps the series of higher highs & lows from the yearly-low ($54.79).
- In turn, a $55.00 (61.8% expansion) to $55.30 (61.8% retracement) region raising the risk for a move towards the $52.00 (50% expansion) handle.
- Keep a close eye on the RSI as it fails to preserve the bearish formation carried over from the previous month, with the oscillator at risk of flashing a bullish signal once it climbs out of oversold territory and trades above 30.
- A bullish RSI signal may accompany a move back towards the Fibonacci overlap around $59.00 (61.8% retracement) to $59.30 (78.6% expansion), with the next region of interest coming in around $62.40 (23.6% expansion) to $63.60 (38.2% retracement).
For more in-depth analysis, check out the Q4 Forecast for Oil
Additional Trading Resources
Are you looking to improve your trading approach? Review the ‘Traits of a Successful Trader’ series on how to effectively use leverage along with other best practices that any trader can follow.
Want to know what other currency pairs the DailyFX team is watching? Download and review the Top Trading Opportunities for 2018.
— Written by David Song, Currency Analyst
Follow me on Twitter at @DavidJSong.