S&P 500/Dow Jones/Nasdaq 100 Technical Highlights:
- S&P 500 trading at 200-day, price levels still higher
- Dow Jones eyes price zone around 25825/677
- Nasdaq 100 is very near the 200-day MA
Check out the forecasts for Global Stock Indices and other markets on the Trading Guides page.
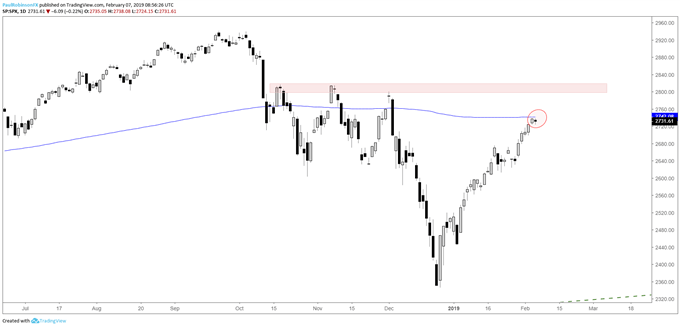
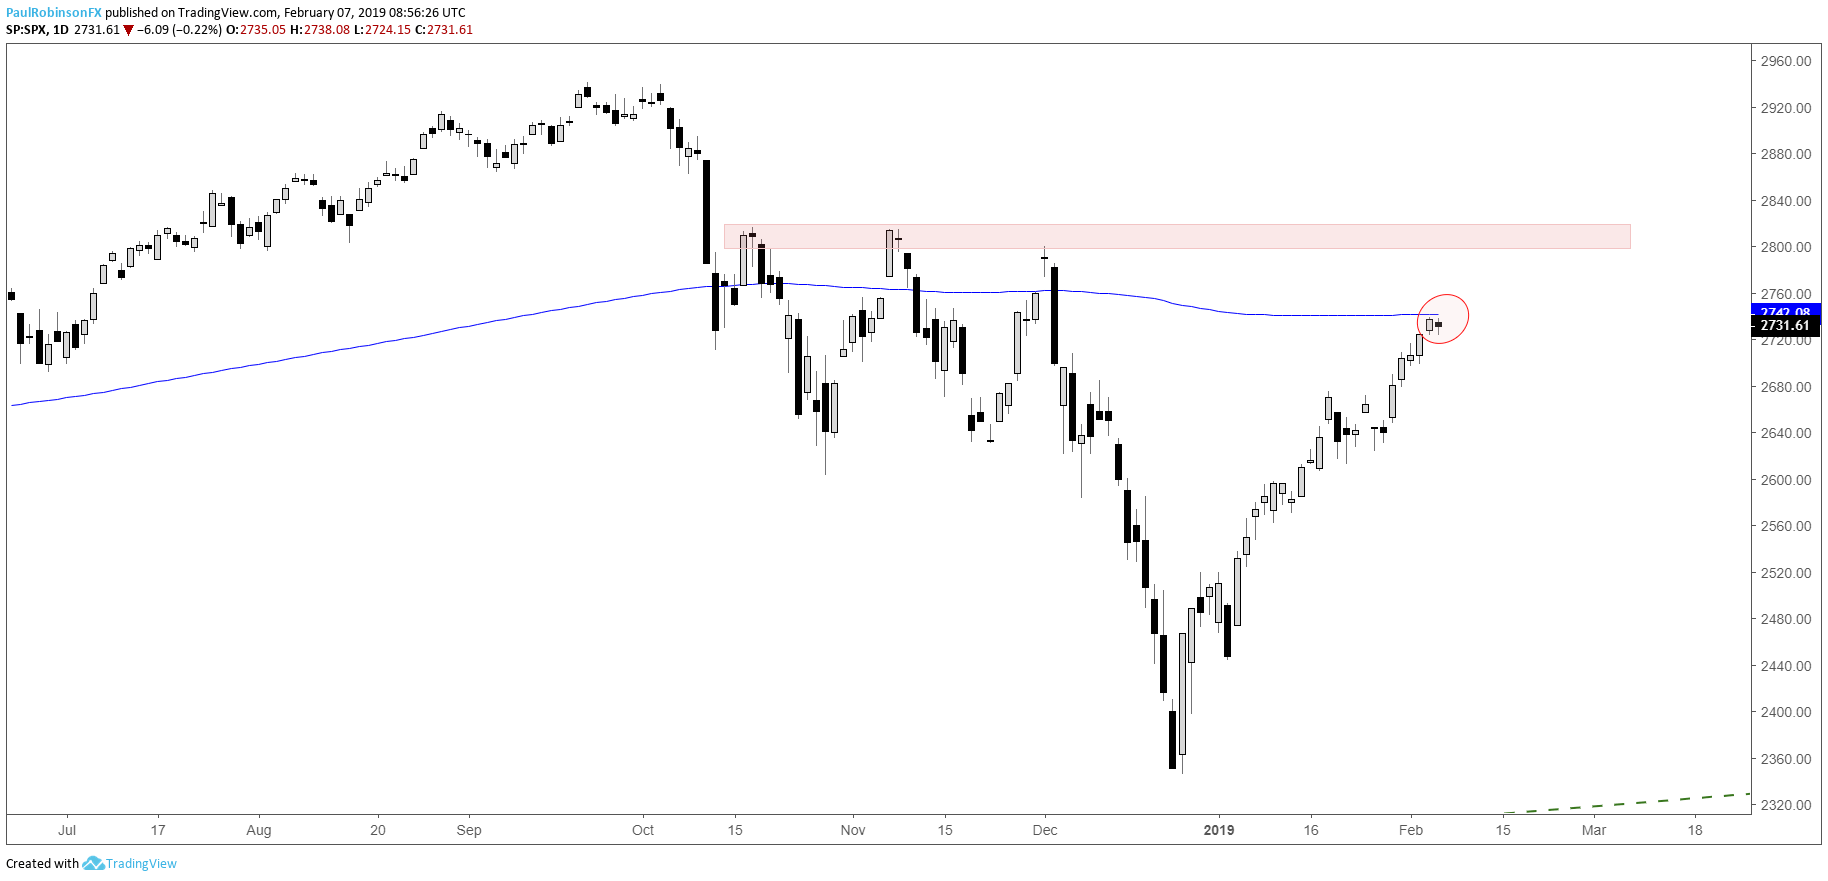
S&P 500 trading at 200-day, price levels still higher
The S&P 500 is trading just a shade below the 200-day MA, and with it around this widely-watched long-term threshold interesting things can happen. Yesterday’s range was extremely small, so look for that as a potential precursor to expanded volatility the next couple of days.
If the 200-day doesn’t put some type of dent in the ascent off the December low, then look for the 2800/16 zone to be a very difficult one to get through. I discuss this regularly in webinars, but there are levels (support/resistance) and then there is price action those levels. So far we not seen anything to suggest the rise is over or at least ready for the market to reverse gears. For now, have to respect bullish momentum until it gets turned on its head.
With global stock market volatility high, see where our analysts see stocks headed in the Q1 Global Equities Forecast.
S&P 500 Daily Chart (200-day, price levels higher)
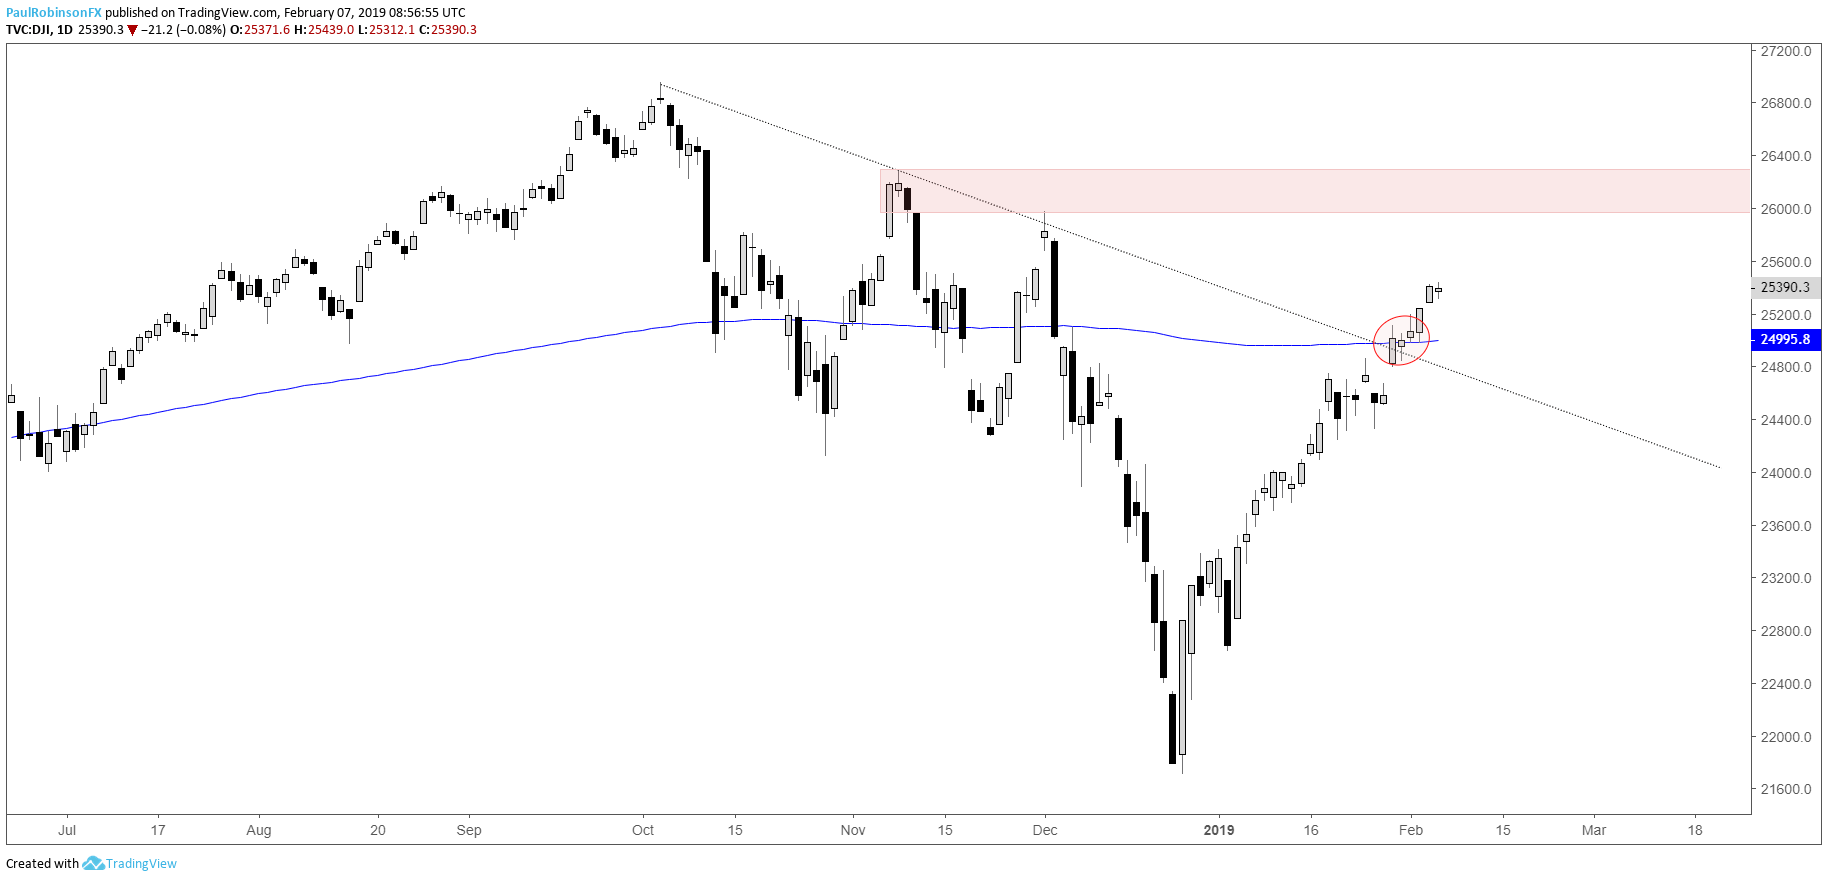
Dow Jones eyes price zone around 25825/677
The Dow hesitated at the 200-day but has since risen a few hundred points above. This leaves the index between solid support and below the next levels of resistance in the vicinity of 25825/677. Whether the market can climb to that area without first consolidating or retreating is yet to be seen, but for now the felling is the market is too strong to short and too high to buy.
Dow Daily Chart (Price zone ahead)
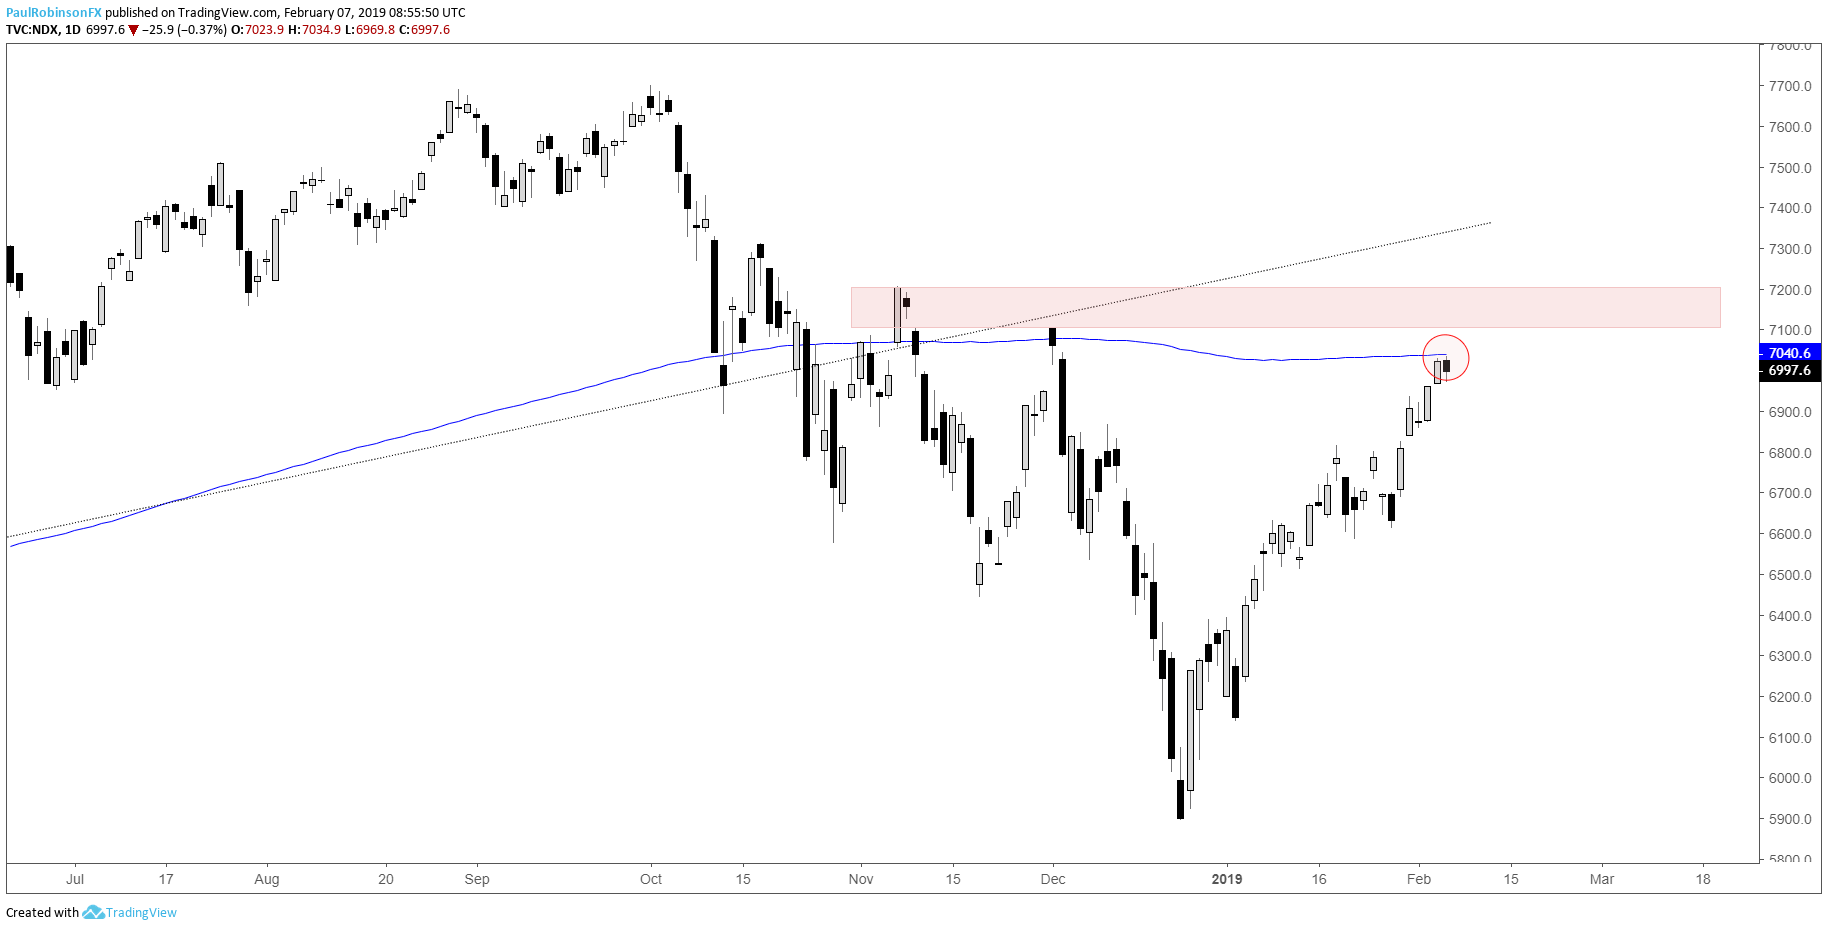
Nasdaq 100 is very near the 200-day MA
Like the S&P 500, the Nasdaq 100 is also trading right near its 200-day MA. If it can trade through it won’t be far, though, before price resistance arises from 7100 up to 7200. A pullback looks likely to be near but we’ll need, as discussed with regard to the S&P, to see price action suggest the rise is due for a break or worse.
Nasdaq 100 Daily Chart (200-day)
To learn more about U.S. indices, check out “The Difference between Dow, Nasdaq, and S&P 500: Major Facts & Opportunities.” You can join me every Wednesday at 10 GMT for live analysis on equity indices and commodities, and for the remaining roster of live events, check out the webinar calendar.
Tools for Forex & CFD Traders
Whether you are a beginning or experienced trader, DailyFX has several resources available to help you; indicator for tracking trader sentiment, quarterly trading forecasts, analytical and educational webinars held daily, trading guides to help you improve trading performance, and one specifically for those who are new to forex.
—Written by Paul Robinson, Market Analyst
You can follow Paul on Twitter at @PaulRobinsonFX