US Dollar Price Action Talking Points
- The US Dollar has had a wild ride today, first rallying up to a fresh two-year-high before a set of poor PMI’s brought in the sellers. At this point, the US Dollar has erased the entirety of this week’s gains and is currently showing a bearish engulfing candlestick on the daily chart.
- This weekend brings considerable gap-risk in the Euro as European Parliamentary elections go through Sunday.
- DailyFX Forecasts are published on a variety of currencies such as Gold, the US Dollar or the Euro and are available from the DailyFX Trading Guides page. If you’re looking to improve your trading approach, check out Traits of Successful Traders. And if you’re looking for an introductory primer to the Forex market, check out our New to FX Guide.
US Dollar False Break – Bearish Engulfing
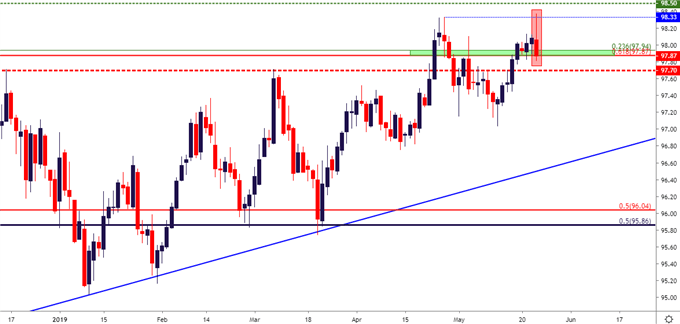
It’s been a wild day in the US Dollar, as the currency started the US session with a push up to a fresh two-year-high. But, that theme of strength did not last for long, as a poor PMI report released at 9:45 AM brought out the bears and, at this point, sellers remain in-control of near-term price action. On the Daily chart, the US Dollar is now working on a bearish engulfing pattern after a failed breakout at the two-year-high, and this can bring interest to short-side themes in the US Dollar.
US Dollar Daily Price Chart

Chart prepared by James Stanley
Stocks Rocked as Risk Aversion Creeps Back In
Going along with USD-volatility has been a volatile backdrop in global risk markets, perhaps best illustrated in US stocks that have put in a very bearish day of price action so far. While there are a number of bearish factors in the backdrop, the item that really stands out here is FOMC policy stance. The S&P 500 began to reverse earlier this month on the heels of the FOMC rate decision as the bank wasn’t quite as dovish as what market participants had been expecting. That weakness lasted through the first half of May as 50% of the March-April rally was taken-out. But, once support at 97.04 played in, prices rallied and continued to do so into this week. But yesterday’s FOMC minutes echoed that earlier-month lack of dovishness at the Fed, and similar to S&P price action on May 1, prices have been selling-off in the aftermath.
At this point, the S&P 500 is testing an interesting level of support around the 2810 level on the chart. A hold here keeps the door open for bullish reversals but, should this area give way, focus can quickly move back to the short-side of the theme.
S&P 500 Four-Hour Price Chart

Chart prepared by James Stanley
EUR/USD False Breakout, Buyers Push Rally Back into Prior Support
It’s been a rough day for EUR/USD bears as prices did technically put in a fresh multi-year low. But, there wasn’t much run-lower and prices quickly reversed back into a key area on the chart. European Parliamentary elections going into this weekend could keep the pair on the move, and the Euro carries significant risk for gaps as those elections run through Sunday. If you’re looking for a primer on this theme, our own Dmitri Zabelin has produced an excellent write-up on the matter entitled, EURUSD at Risk on 2019 European Parliamentary Elections.
EUR/USD Four-Hour Price Chart

Chart prepared by James Stanley
GBP/USD: Mayhem, Beware of Bear Traps
Prices in GBP/USD have continued to sell-off into today as a series of risk factors remain around the UK. At this point, no one really knows how Brexit is going to shape up and it looks as though we’re not even sure who will be leading the UK through this theme in the coming months. Nonetheless, an oversold GBP/USD has caught a bid to go along with the US Dollar’s pullback and, at this point, lower-high resistance is showing around prior support. This may be a bear trap scenario, and traders looking to on-load short-side Sterling exposure may want to wait for a deeper retracement before plotting strategy-lower.
GBP/USD Eight-Hour Price Chart
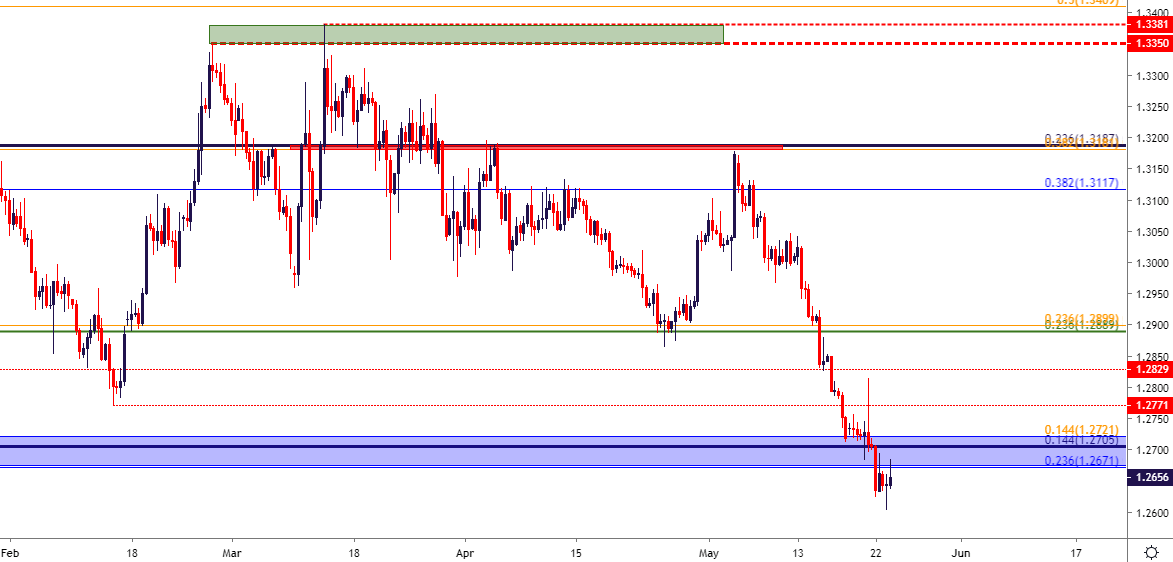
Chart prepared by James Stanley
USD/CAD: Vigorous Bounce Inside of the Range
I had looked at this one earlier this morning as USD/CAD was hard-charging towards the 1.3500 resistance that’s held the highs over the past month. The notable item here was the support reaction yesterday, when USD/CAD tipped-below the 1.3361 Fibonacci level on the chart. At this point, range strategies remain a workable theme and, as discussed earlier today, there is scope for bullish strategies should the backdrop line up for such.
USD/CAD Four-Hour Price Chart
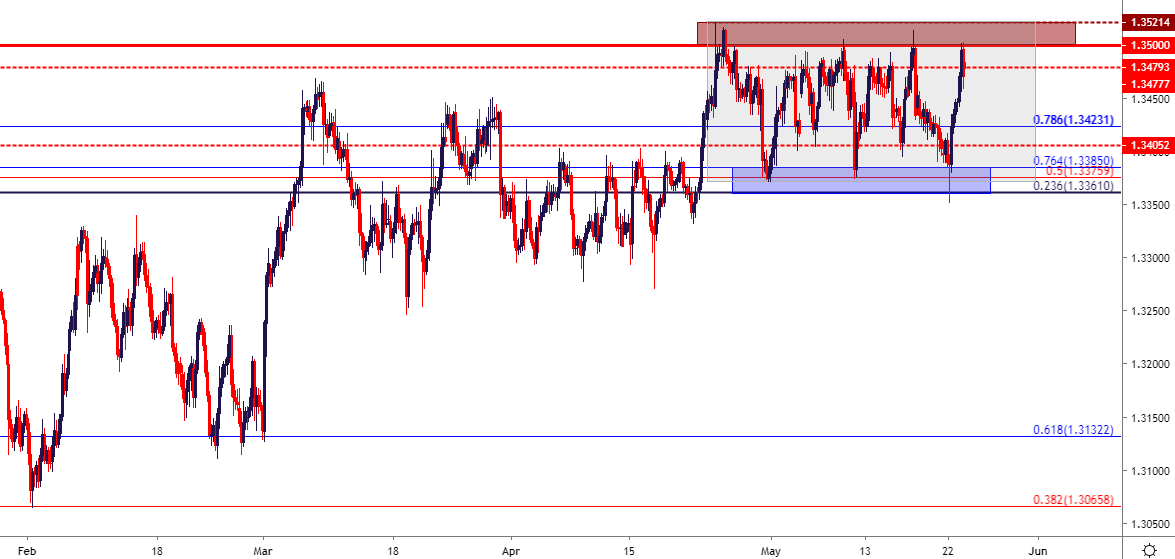
Chart prepared by James Stanley
USD/JPY Highlights Risk Aversion
Going along with the theme of increasing risk aversion, Yen-strength has remained around the US Dollar even as DXY was pushing up to fresh two-year highs today. At this point, price action in the pair is at a tough spot on the chart, having traded through the psychological 110.00 level. This will likely need a bit of fill-in before either bearish or bullish scenarios can become attractive again. Perhaps the closest next theme of interest is a pullback to resistance in the prior support zone that runs from 109.67-110.00.
USD/JPY Four-Hour Price Chart
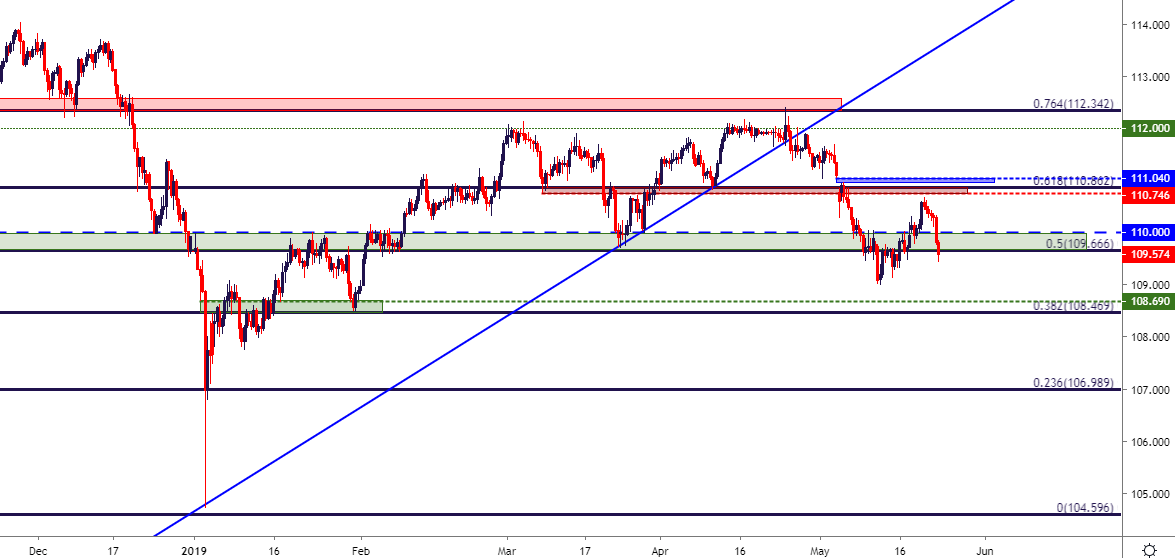
Chart prepared by James Stanley
AUD/USD Recovery?
It’s been a brutal two-week stretch for AUD/USD. The pair broke below the .7000 handle and did not stop. Prices finally found a semblance of support around the 76.4 and 78.6% retracements of the 2019 major move. I had looked into this scenario on Monday and, at this point, the lows have held and the door may soon be opening to bullish strategies in the pair.
AUD/USD Hourly Price Chart
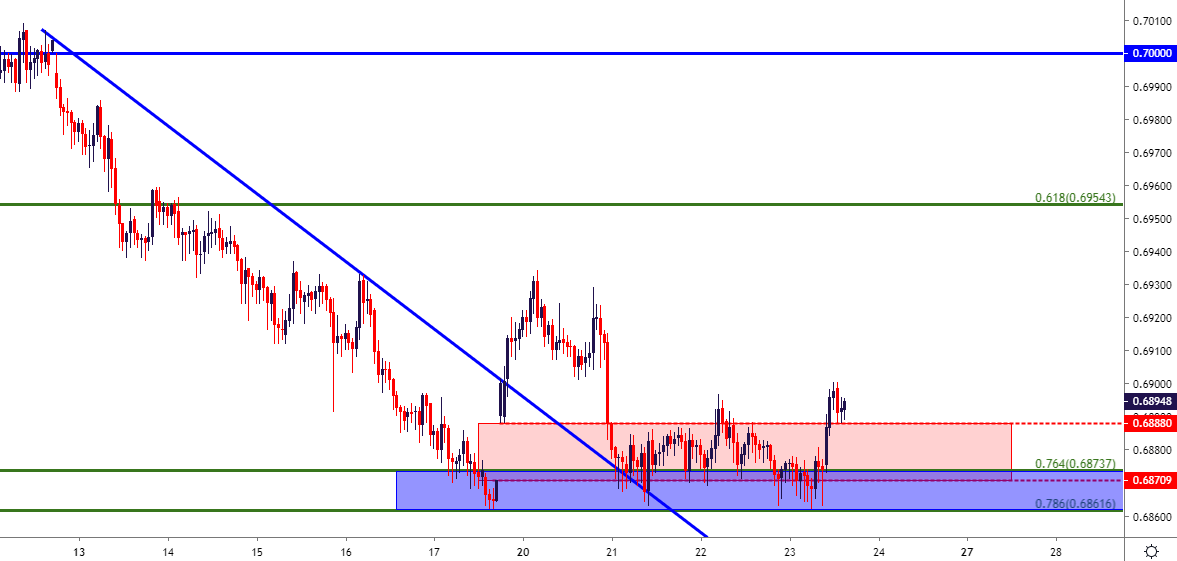
Chart prepared by James Stanley
NZD/USD Attempting to Hold the Lows
Similar theme in NZD/USD as looked at above in AUD/USD. The big area of interest here is the .6500 handle, and a hold of short-term higher-low support can soon re-open the door to bullish strategies in the pair; particularly for those looking to work with short-side USD scenarios on the basis of the bearish engulfing candlestick on today’s price action.
NZD/USD Hourly Price Chart
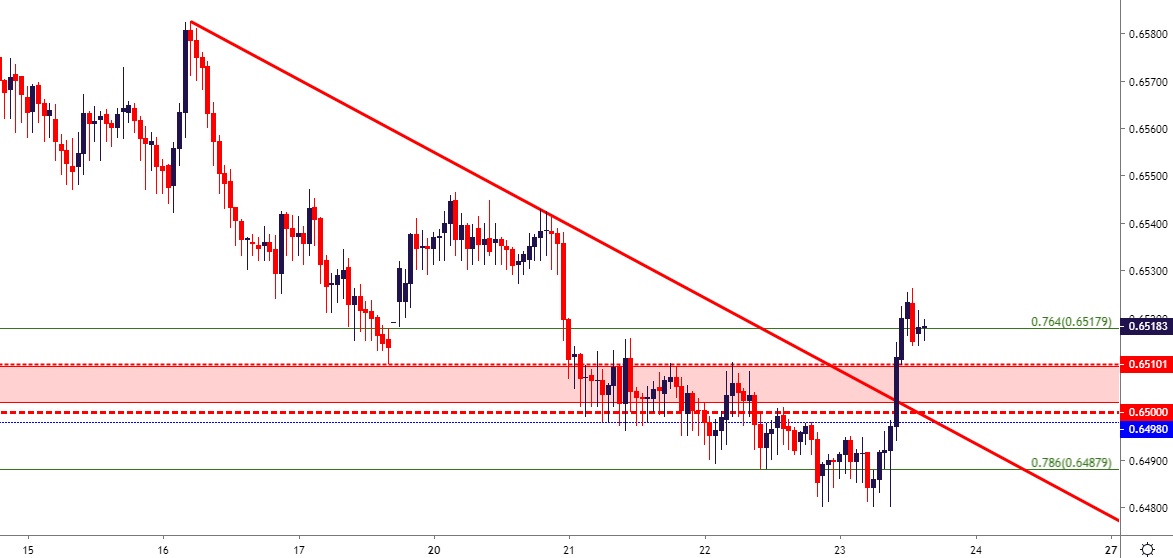
Chart prepared by James Stanley
Gold Rallies Up to Key Fib – Now What
Risk aversion is running, the Dollar is dropping and Gold is rallying. Bulls have come back into the yellow metal and resistance has showed at a key area on the chart of 1286.38, which is the 61.8% retracement of the 2013-2015 major move. At this point, support around prior resistance could open the door for bullish trend scenarios. The area looked at in the webinar spans from the approximate 1277.50 up to the 1280.50 area of prior support.
Gold Price Two-Hour Chart
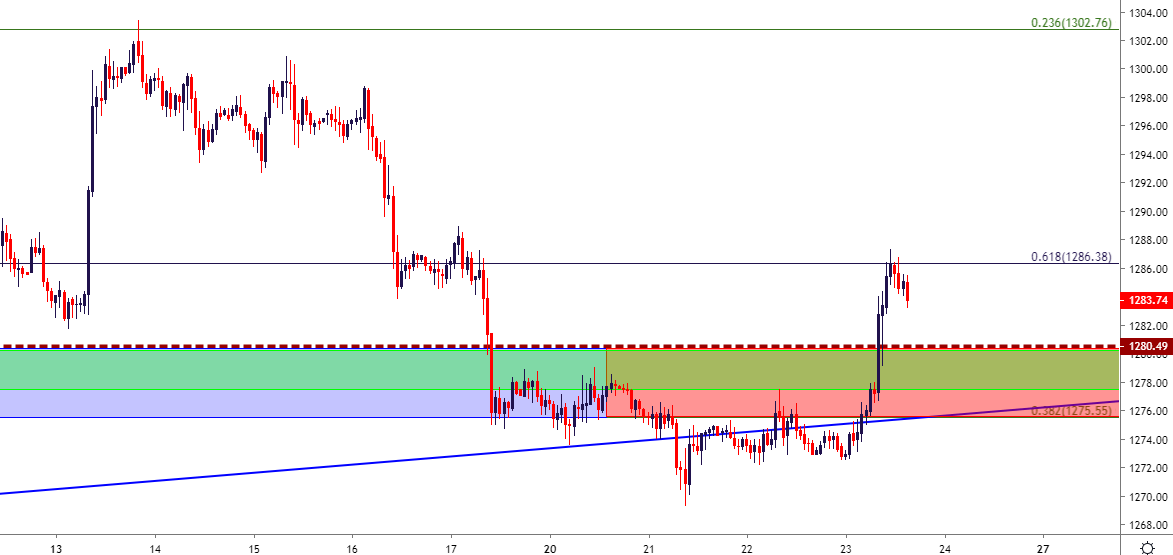
Chart prepared by James Stanley
Oil Crushed – Fib in Play – Reversal Potential
It can be very difficult to get bullish on a market like Crude Oil that’s just been shell-shocked to a fresh three-month-low. But – selling at this point could be a challenge given the size of the move thus far and the proximity to recent swing-highs. On the long-side, however, support has come-in at a key Fibonacci level that had previously helped to hold resistance. The price of 57.47 is the 38.2% retracement of the 2016-2018 major move and since breaking-above in March, price action has yet to test this level for support.
Crude Oil Eight-Hour Price Chart

Chart prepared by James Stanley
Dow Drop Closes In on Four-Month Lows at Key Fib
Stocks have been on offer over the past two days, getting some additional short-side run after yesterday’s FOMC minutes release. At this point, price action is fast approaching a key area on the chart at 25,266, which is the 14.4% retracement of the 2015-2018 major move. This same price helped to hold the lows in March and again in early-May. A hold of higher-lows around that level keeps the door open for reversal strategies: A break-below, however, opens the door for short-side breakouts targeting the 25k psychological level.
Dow Jones Four-Hour Price Chart
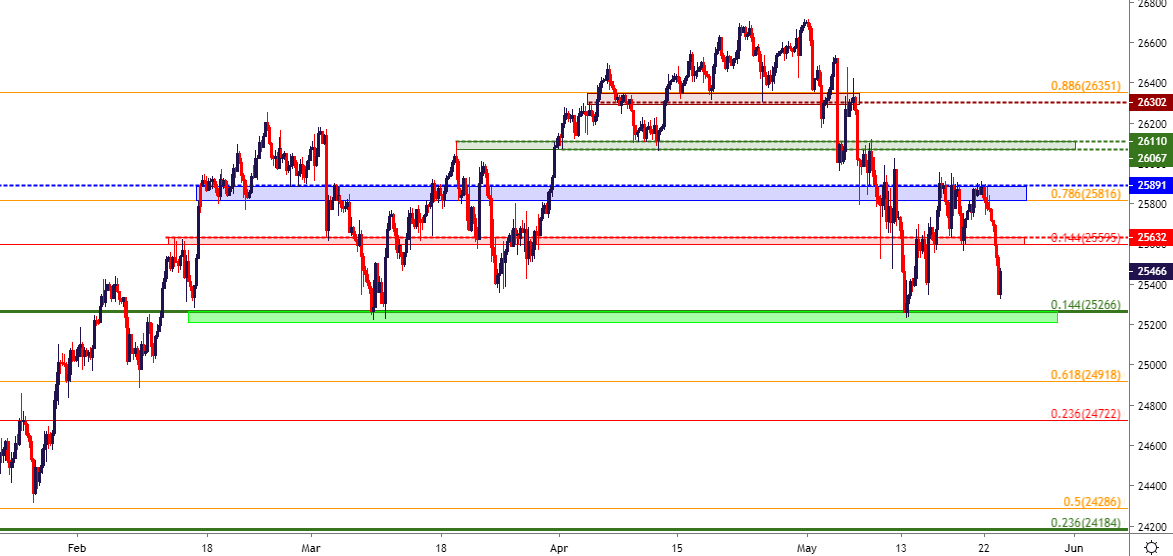
Chart prepared by James Stanley
DAX Tests Confluent Support: Can Bulls Hold the Line?
Similar backdrop here as DAX weakness has shown prominently so far today. Prices are at a key area of confluence on the chart. A hold keeps the door open for bullish reversals: A break-below opens the door for bearish breakouts.
DAX Daily Price Chart
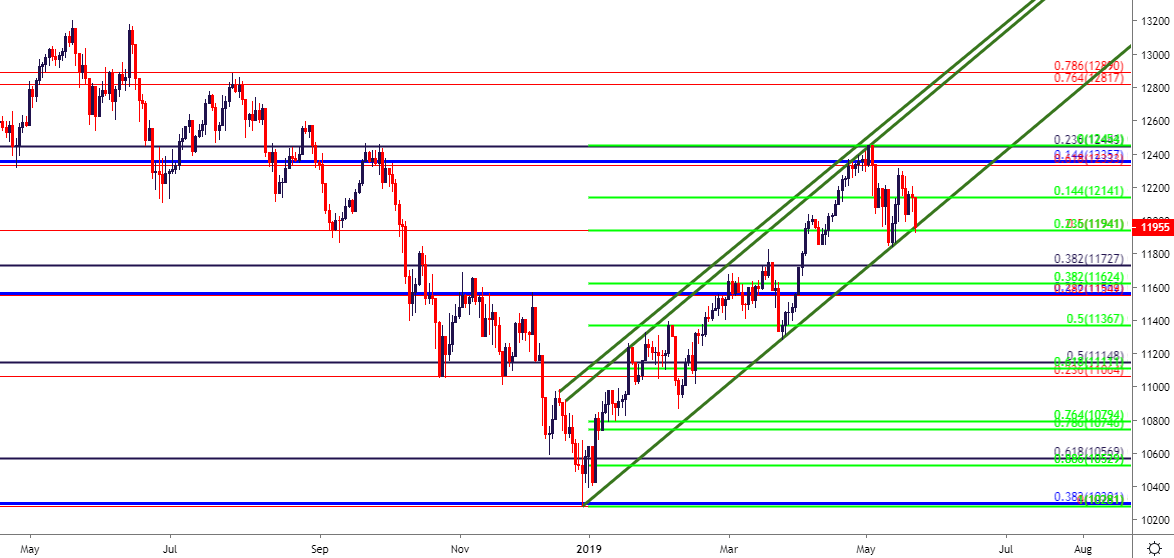
Chart prepared by James Stanley
To read more:
Are you looking for longer-term analysis on the U.S. Dollar? Our DailyFX Forecasts have a section for each major currency, and we also offer a plethora of resources on Gold or USD-pairs such as EUR/USD, GBP/USD, USD/JPY, AUD/USD. Traders can also stay up with near-term positioning via our IG Client Sentiment Indicator.
Forex Trading Resources
DailyFX offers an abundance of tools, indicators and resources to help traders. For those looking for trading ideas, our IG Client Sentiment shows the positioning of retail traders with actual live trades and positions. Our trading guides bring our DailyFX Quarterly Forecasts and our Top Trading Opportunities; and our real-time news feed has intra-day interactions from the DailyFX team. And if you’re looking for real-time analysis, our DailyFX Webinars offer numerous sessions each week in which you can see how and why we’re looking at what we’re looking at.
If you’re looking for educational information, our New to FX guide is there to help new(er) traders while our Traits of Successful Traders research is built to help sharpen the skill set by focusing on risk and trade management.
— Written by James Stanley, Strategist for DailyFX.com
Contact and follow James on Twitter: @JStanleyFX