
Canadian Dollar Price Forecast, CAD, USD/CAD Talking Points:
- USD/CAD pushed down to a fresh three-week-low this morning.
- Canadian employment numbers came out strong, beating expectations on both the headline print and the unemployment rate.
- The analysis contained in article relies on price action and chart formations. To learn more about price action or chart patterns, check out our DailyFX Education section.
It’s been a rough week for the US Dollar; and given the addition of some CAD-strength, helped along by higher Oil prices, USD/CAD has pushed down to a fresh three-week-low. This morning also brought out the release of Canadian employment numbers which, by and large, printed with some positivity. The Canadian economy added 378.2k jobs versus an expectation of 156.6k; and the unemployment rate of 9% beat the expectation for a 9.7% print and was well inside of last month’s 10.2% read.
That employment report helped to bring an impulse move into the pair as price action pushed down to a fresh three-week low until, eventually, USD/CAD found support around a familiar Fibonacci level, plotted around the 1.3148 area on the chart, which is the 88.6% retracement of the 2020 move in the pair.
USD/CAD Hourly Price Chart
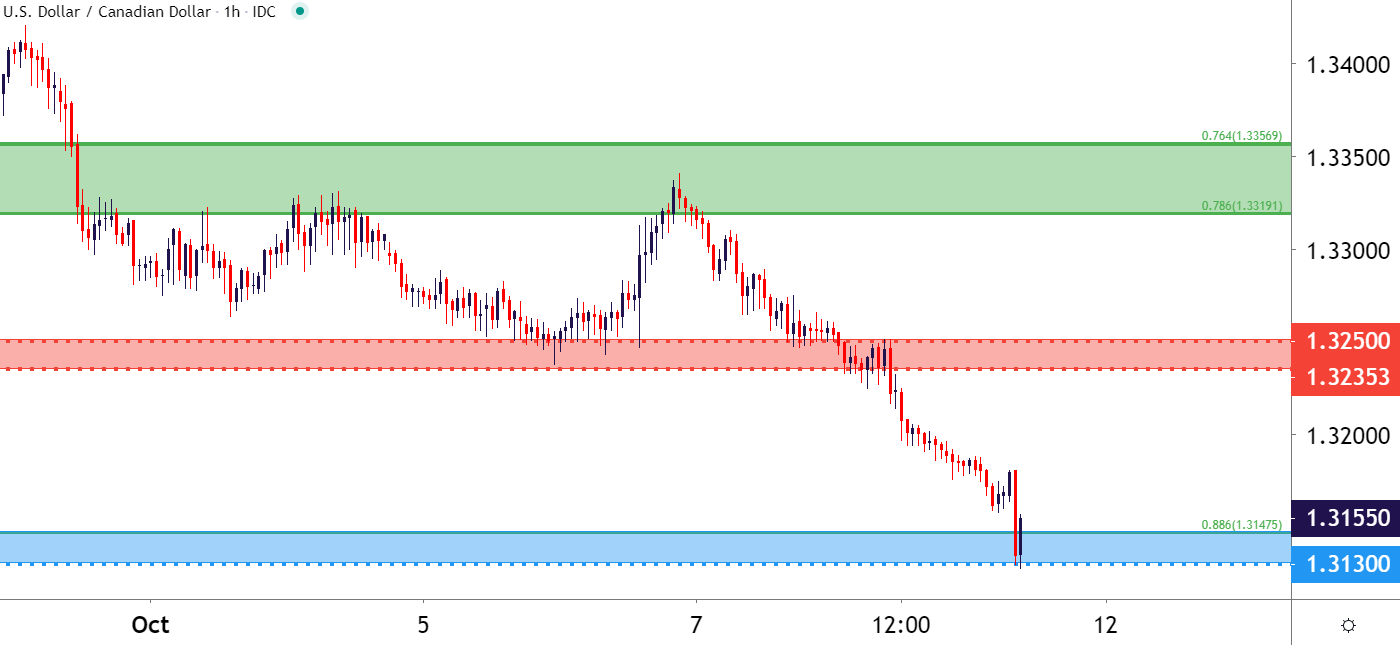
Chart prepared by James Stanley; USDCAD on Tradingview
This zone of support had previously helped to establish a short-term bullish trend in USD/CAD. As discussed previously, USD/CAD presented a pretty attractive venue for trading themes around the USD, particularly as the September reversal began to play through. After a near-six-month bout of weakness, both USD and USD/CAD spent much of September trending higher. In USD/CAD, this zone of support, plotted from around 1.3132-1.3150, helped to cauterize a higher-low in mid-September before the pair flung up to fresh higher-highs.

Recommended by James Stanley
Building Confidence in Trading
But as USD-strength has begun to dissipate as the page has turned into Q4, so has that bullish theme in USD/CAD, bringing to question the viability of topside strategies in the near-term as buyers have remained on their back foot.
USD/CAD Daily Price Chart
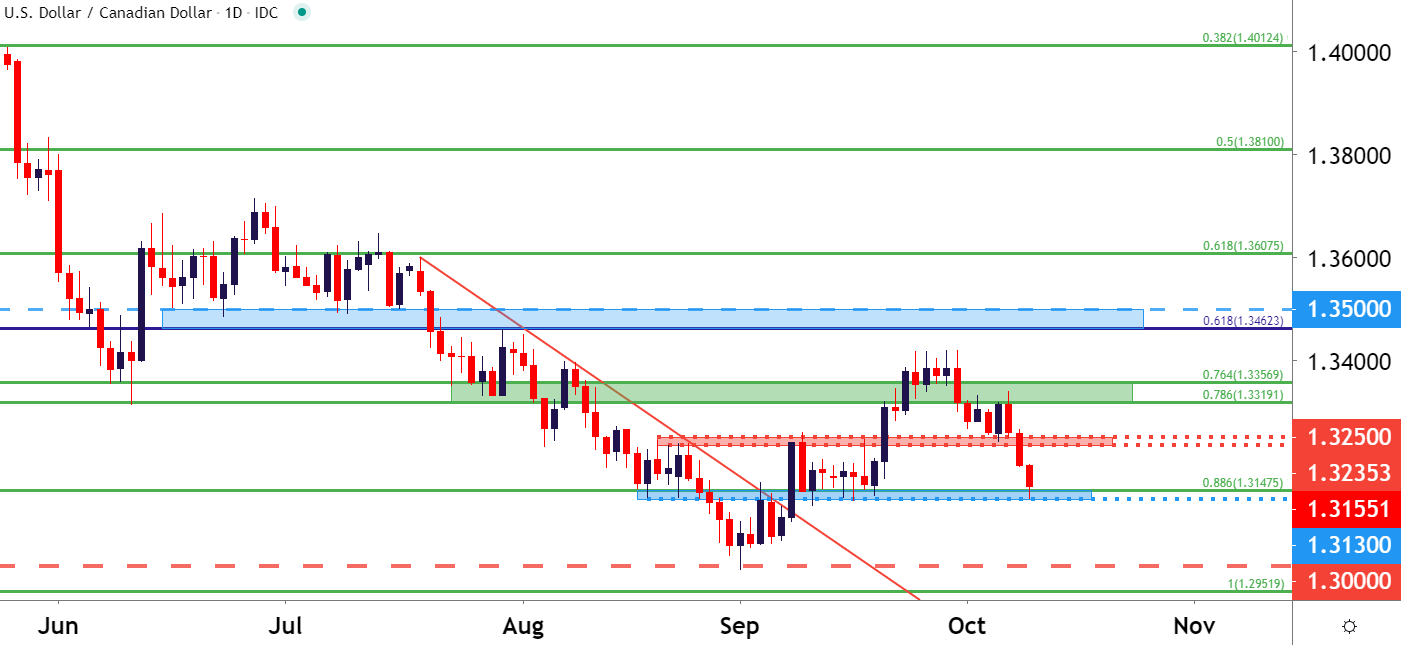
Chart prepared by James Stanley; USDCAD on Tradingview
USD/CAD Strategy Moving Forward
At this point, the big question is whether buyers will step in to support a higher-low on the longer-term charts of both USD and USD/CAD. For swing traders – a hold of support in this zone could keep the door open for bullish scenarios, looking for a bounce after a very visible move-lower.
The key item of resistance in that case would be around the prior area of support, plotted around the 1.3250 level. This support held the lows on Tuesday of this week, leading into a quick bounce into the 3319-3357 zone; but now that support has been taken out, this can present an item of potential near-term resistance.
| Change in | Longs | Shorts | OI |
| Daily | 2% | -19% | -4% |
| Weekly | 18% | -25% | 2% |
For shorter-term traders, a revisit to that resistance can open the door for bearish strategies. The big question, in that case, is one of downside potential, as the 1.3000 level has so far proven to be a tough area to break-through for USD/CAD bears over the past couple of years.
USD/CAD Four-Hour Price Chart
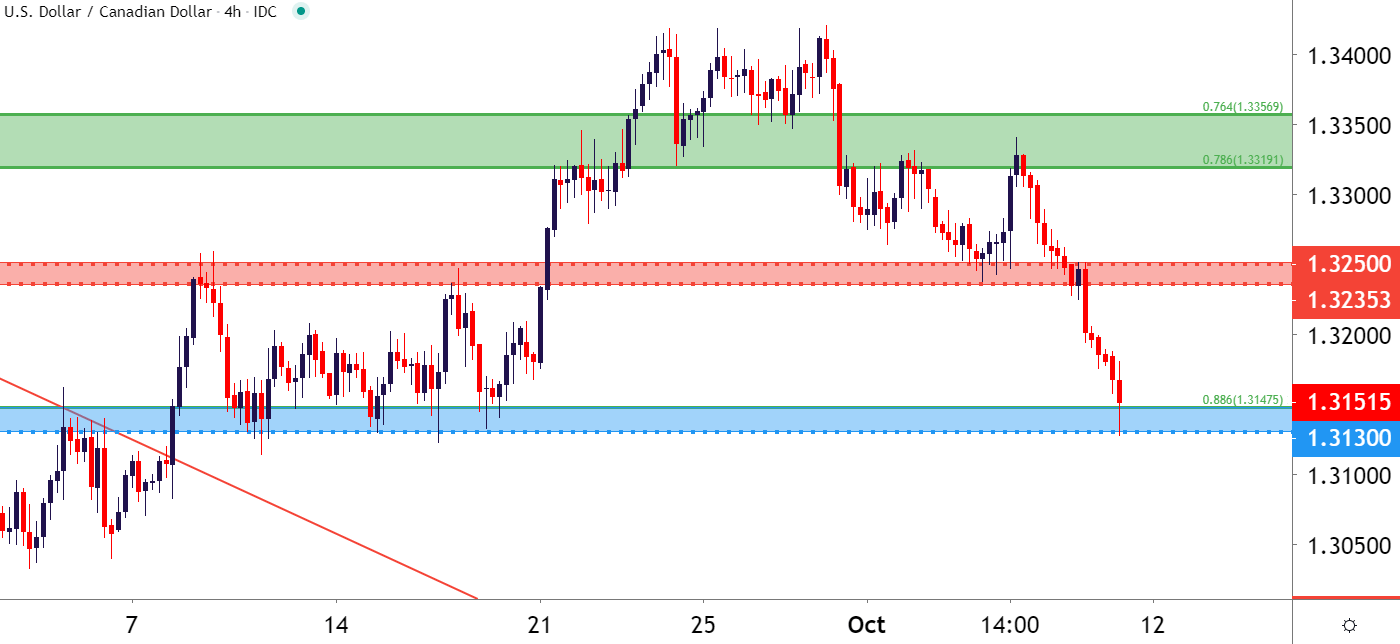
Chart prepared by James Stanley; USDCAD on Tradingview
— Written by James Stanley, Strategist for DailyFX.com
Contact and follow James on Twitter: @JStanleyFX