
Source: IG Charts
USD/JPY Price, News and Analysis:
- Bank holiday liquidity may be behind the sharp move lower in USD/JPY.
- Safe-havens benefit as US-China tensions continue to escalate.

Recommended by Nick Cawley
Brand New Q3 Japanese Yen Guide
The Japanese Yen remains well bid at the end of the week as the US and China continue to provoke each other, fueling demand for safe-haven assets. After the US ordered the closure of the Chinese consulate in Houston mid-week, the Chinese government retaliated overnight, ordering the shuttering of the US consulate in Chengdu. With the relationship between the two superpowers already at breaking point, any further ramping up of hostilities will see demand for the Japanese Yen increase, putting additional downward pressure on USD/JPY.
The weakness of the US dollar is clear to see in the FX market with many USD-pairs trading at multi-month levels. EUR/USD touched a 21-month high this week, USD/JPY is at a four-month low, while GBP/USD is at a six-week high. The USD/JPY move lower started overnight in thin-trading conditions with Japan closed for the Marine Day public holiday. It may be that at least part of this move lower is corrected at the start of next week when Tokyo, and Yen-liquidity, rejoins the fray, or it may be that this is an accelerated shift into JPY, and the Euro, from the US dollar. Next Wednesday sees the latest policy announcement from the Federal Reserve and markets are already suggesting that the Fed will make a further dovish shift to counter the economic hardship caused by COVID-19.
How Central Banks Impact the Forex Market
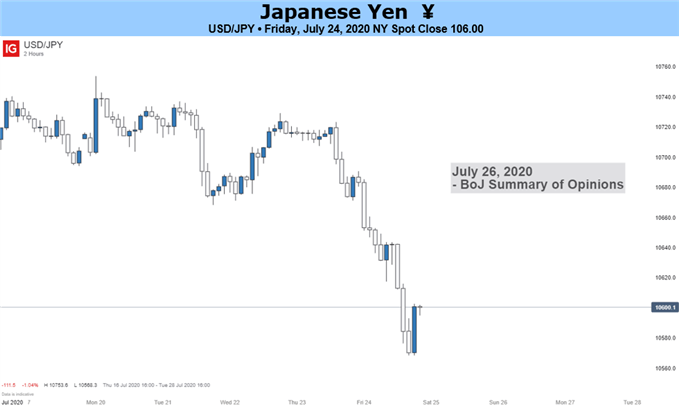
There is little in the way of Japanese market-moving data out next week with the Bank of Japan summary of opinions (July 27), retail sales (July 30) and unemployment numbers (July 31) the pick of a limited bunch. For all market-moving data releases and events see the DailyFX Economic Data and Events Calendar
A look at the daily USD/JPY chart shows today’s outsized move lower. The trading range of over 1 big figure is twice the Average Trading Range (ATR) and the move has sent the CCI indicator deep into oversold territory. The Asian open next week needs to be closely monitored.
USD/JPY Daily Price Chart (December 2019 – July 24, 2020)

| Change in | Longs | Shorts | OI |
| Daily | 18% | -11% | 5% |
| Weekly | 27% | -7% | 12% |
What is your view on USD/JPY – bullish or bearish?? You can let us know via the form at the end of this piece or you can contact the author via Twitter @nickcawley1.