WTI/Brent Crude Oil Technical Highlights
- WTI oil price action wedging up towards a breakout
- Brent crude triangle building on 2016 trend-line
To see our intermediate fundamental and technical outlooks, check out the Crude Oil Forecast.
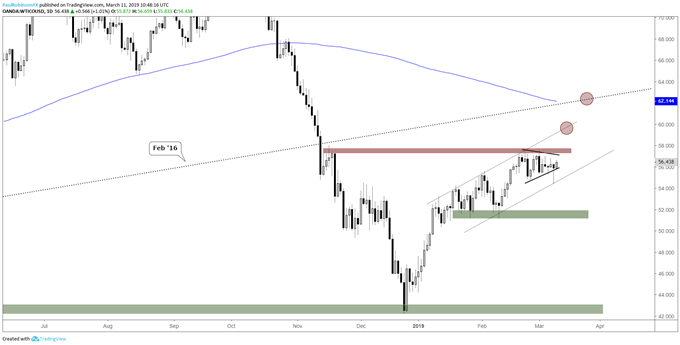
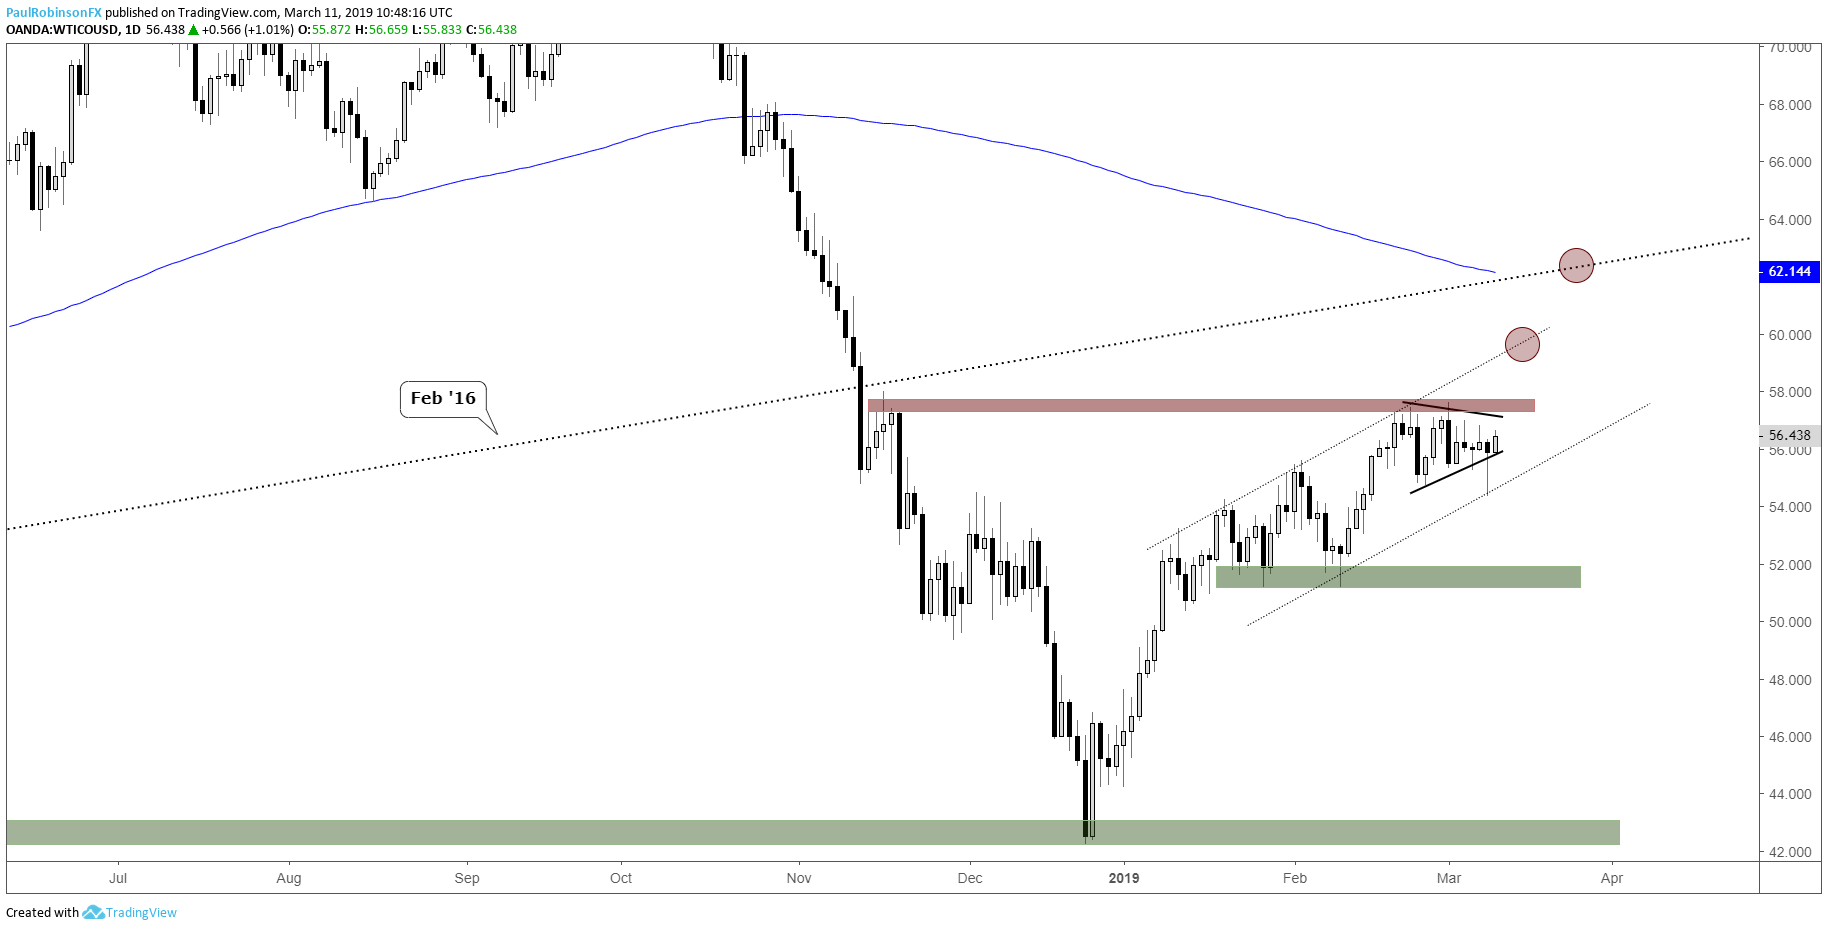
WTI oil price action wedging up towards a breakout
WTI (U.S.) crude oil has been undergoing a process of indecision and with it a narrowing range suggesting a breakout is very near. The developing wedge is at a point where it could break at any time, the question is in which direction?
Wedge-breaks are generally best to be reacted to and not predicted even if there are signs which imply one direction is more likely than the other, which is currently the case.
The trend off the December low (and Jan-current channel) points to higher prices, as does Friday’s semi-bullish reversal candle. With that in mind, bullish looks more probable but still need to wait for a confirmed break.
There is solid resistance right around 57.60, so a break out of the triangle to the top-side through resistance will be needed to get WTI into gear. A possible target on a bullish break is the underside of the 2016 trend-line which at this time is in confluence with the 200-day MA.
On the flip-side, a breakdown below Friday’s low at 54.37 will have the 51.90/13 area in focus from Jan/Feb. In either event, up/down or a fake-break in one direction followed by reversing back the other way, traders need to be on high alert for an increase in volatility as price crunches towards a decision point.
WTI Crude oil Daily Chart (Wedge-break coming)
Brent crude triangle building on 2016 trend-line
Brent (U.K.) crude oil is of course playing out similar to the WTI contract, but with one interesting twist. It is sitting on the 2016 trend-line, a line that has seen much play since early December. Further confirming its importance most recently was Friday’s dip and reverse. Just below the long-term trend-line also lies a bed of support via the 63.70/62.70 zone.
Strong support coupled with the multi-month trend and triangle point to a move higher soon. The targeted area of resistance on a break above 67.73 is the low from August that is in confluence with the 200-day MA. A downside break, to put Brent in clearance of support, it will require a daily close below 62.70 to be safe.
Brent crude oil Daily Chart (Triangle on 2016 t-line)

Forex & CFD Trader Resources
Whether you are a new or experienced trader, we have several resources available to help you; indicator for tracking trader sentiment, quarterly trading forecasts, analytical and educational webinars held daily, trading guides to help you improve trading performance, and one specifically for those who are new to forex.
—Written by Paul Robinson, Market Analyst
You can follow Paul on Twitter at @PaulRobinsonFX