Article Written by IG Senior Market Analyst Axel Rudolph
FTSE 100, DAX 40, and Hang Seng Analysis and Charts
Recommended by IG
Traits of Successful Traders
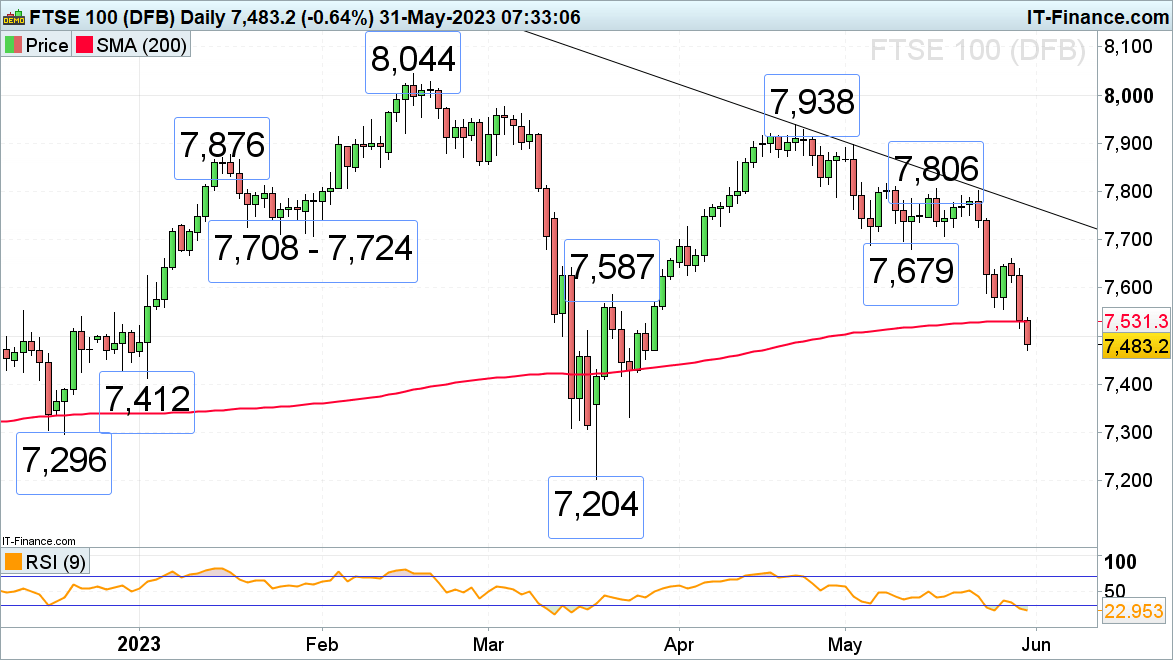
FTSE 100 slumps on oil price weakness
The FTSE 100 is trading in two-month lows on a weaker oil price and has slid through the 200-day simple moving average (SMA) at 7,531 for the first time since March.
The early January low at 7,412 represents the next downside target. Below it the December and 24 March lows can be spotted at 7,331 to 7,296.
Resistance above the 200-day SMA sits at last week’s low at 7,556 and also at the 7,587 22 March high.
FTSE 100 Daily Price Chart – May 31, 2023
Trade Smarter – Sign up for the DailyFX Newsletter
Receive timely and compelling market commentary from the DailyFX team
Subscribe to Newsletter
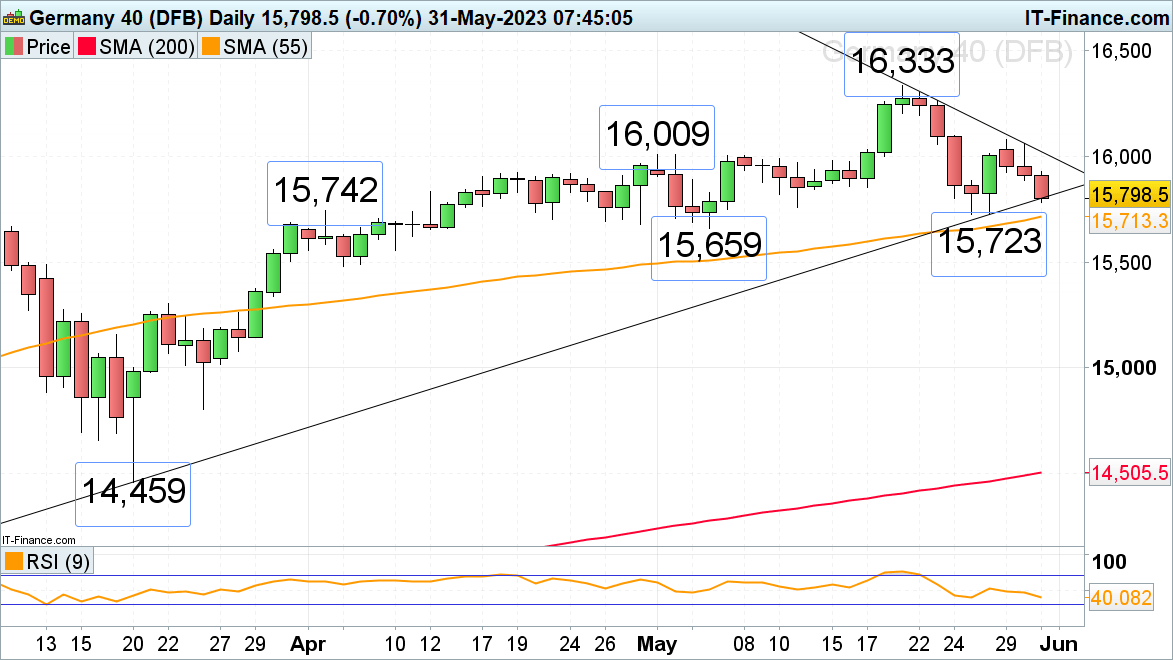
DAX 40 remains under pressure as China manufacturing PMI drops
The DAX 40 continues to slide on the back of weaker Asian stock indices as China manufacturing PMI unexpectedly declines.
The German stock index weighs on its March-to-May uptrend line at 15,798. A fall through this level would target the key 15,723 to 15,659 support zone. It consists of the May lows and the 55-day simple moving average (SMA).
If slipped through on a daily chart closing basis, a medium-term top may be formed with the 15,000 region being back in sight.
Minor resistance can be found at the mid-May low at 15,854 and at Tuesday’s 15,883 low.
Dax 40 Daily Price Chart – May 31, 2023
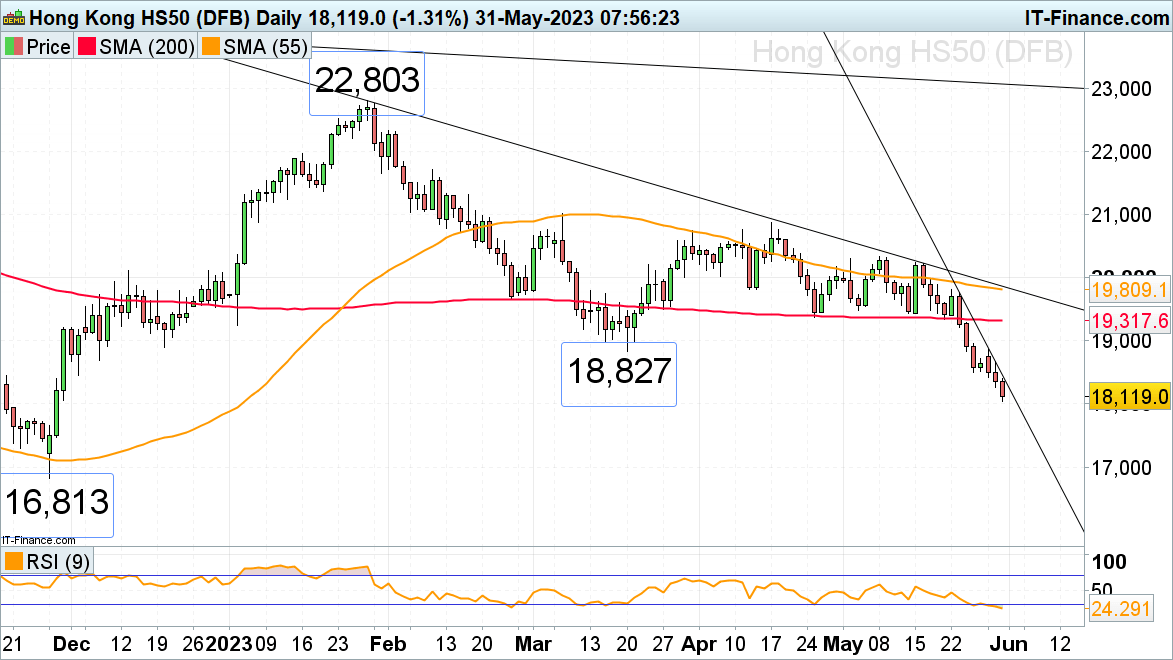
Hang Seng drops by over 20% from its January high
China’s worse-than-expected May PMI data adds to the list of economic downside surprises witnessed so far this year and provides yet another validation of more subdued growth in the world’s second-largest economy.
The Hang Seng is thus trading around 10% lower than at the start of the year and has fallen by over 20% from its January peak at 22,803.
Further downside targets are the 24 November high at 17,763 and then the 22 November low at 17,293, ahead of the late November trough at 16,813.
Resistance above the two-week accelerated downtrend line and last Thursday’s low at 18,470 to 18,499 sits at the March low at 18,827.
Hang Seng Daily Price Chart – May 31, 2023