Bitcoin (BTC) and Ethereum (ETH) Charts and Analysis
- Bitcoin is down over 15% since the start of the year.
- Multi-month support is now being tested.
Bitcoin is testing lows last seen back in September last year after making a confirmed break below the important $45.5k area, a level that had held repeated attempts over the last few weeks. The sell-off has been prompted in part by the US central bank suggesting that it will tighten monetary conditions sooner than previously expected by hiking rates and reducing the Fed’s bloated balance sheet by selling some of their bond holdings. A combination of weak fundamentals and technicals leaves Bitcoin testing lower levels to try and find the next level of support. BTC is testing a support zone between $39.6k and $41.7k as we write and with the CCI indicator suggesting the market is oversold, this support zone may hold in the short term. As always, caution needs to be exercised over the weekend when market conditions can get choppy.
Bitcoin Q1 2022 Fundamental Forecast: Macro Will Matter (More) to Bitcoin
Bitcoin (BTC/USD) Daily Price Chart – January 7, 2022
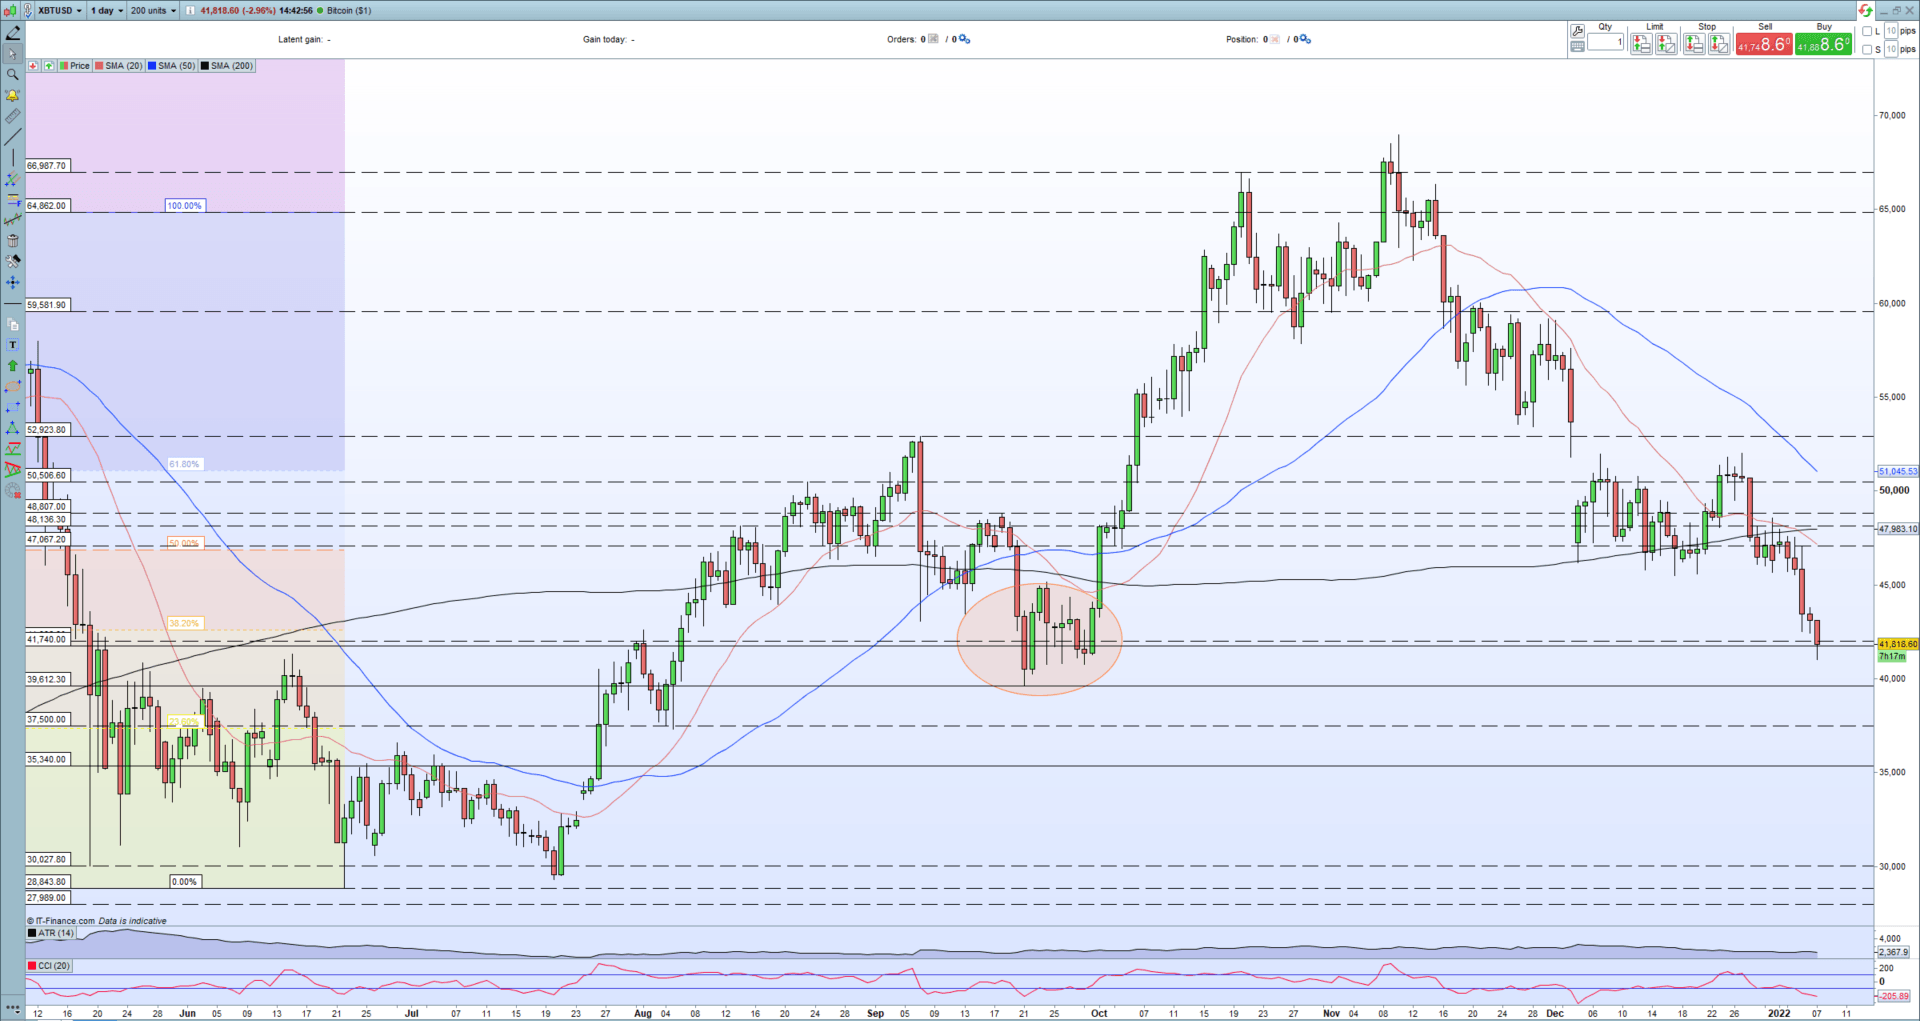
Chart via Pro Real Time
Ethereum is also printing new multi-week lows and is outperforming Bitcoin on the way down. The second-largest cryptocurrency is down 35% in just under two months with little in the way of support on the charts until the September 21 swing low at $2,646 comes into play. Again the chart looks heavily oversold with the CCI indicator at or just close to multi-month lows. Ethereum may slow its recent fall but it will take a lot of price rebuilding to turn the chart positive again.
Ethereum Daily Price Chart – January 7, 2022
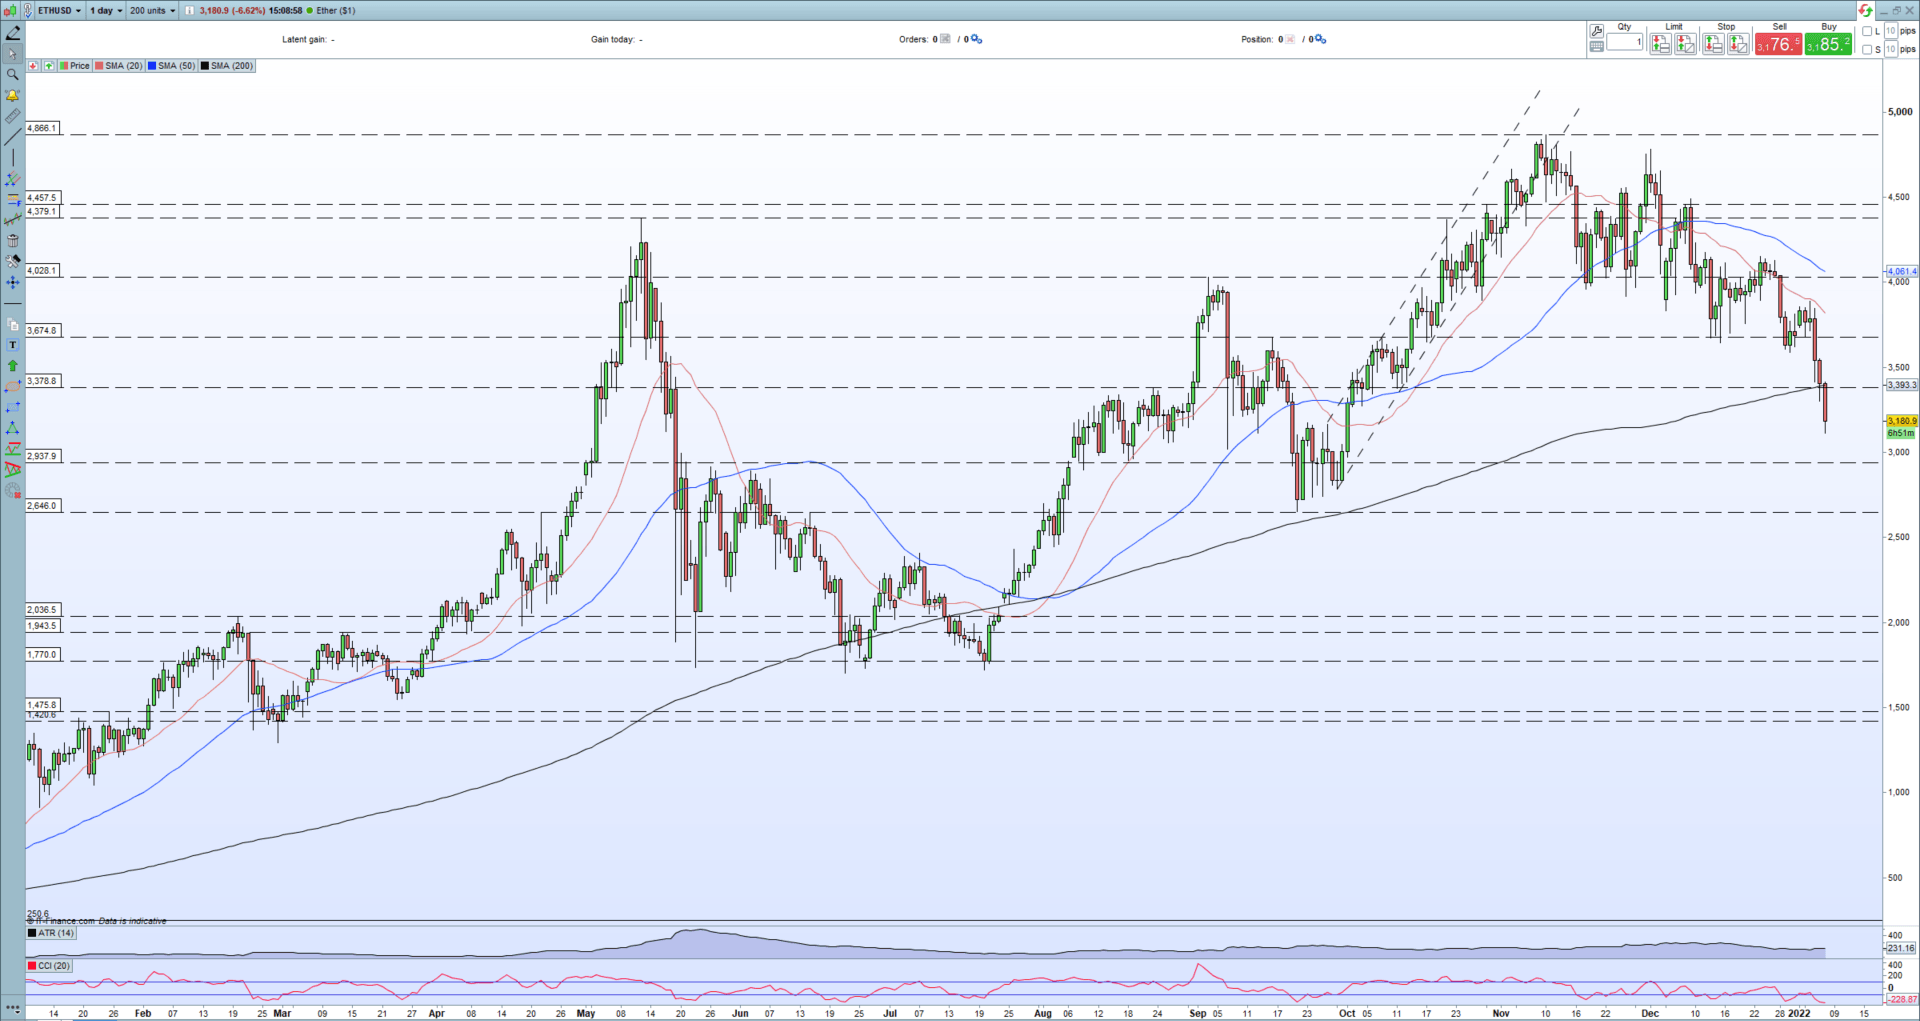
Chart via Pro Real Time
Ethereum’s underperformance against Bitcoin can be clearly seen on the ETH/BTC spread chart, with three large red candles taking the pair back through the 0.0800 zone that has provided support of late.
ETH/BTC Spread January 7, 2022
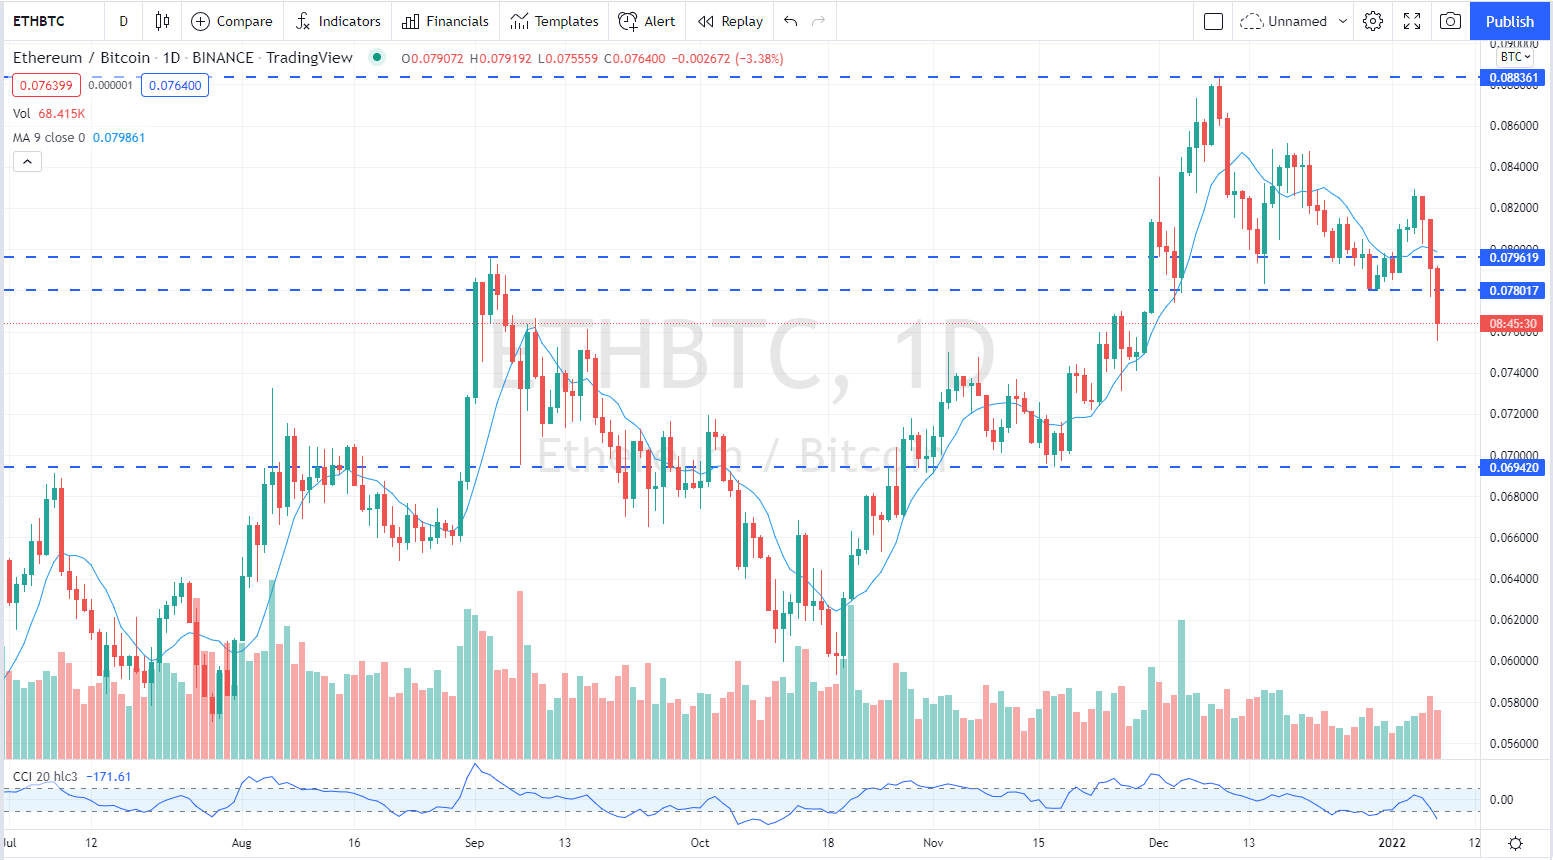
Chart via TradingView
What is your view on Bitcoin and Ethereum – bullish or bearish?? You can let us know via the form at the end of this piece or you can contact the author via Twitter @nickcawley1.