Bitcoin Charts and Analysis
- Bitcoin (BTC) is back to this week’s opening levels.
- Resistance remains in charge for now.
Bitcoin’s price action this week has been fairly muted, apart from a small mid-week pump and dump, with BTC/USD back to within a couple of hundred dollars of this week’s open. The macro picture, the main driver of risk, is also little changed this week as the crisis in Ukraine continues. While talks between Russia and Ukraine continue, there has been little in the way of positive news or progress from either side. On Friday a Tweet attributed to Russian President Vladimir Putin said that there had been ‘certain positive shifts’ in talks with Ukraine but the positive tailwind from this comment in the crypto market soon faded leaving BTC unchanged on the session so far.
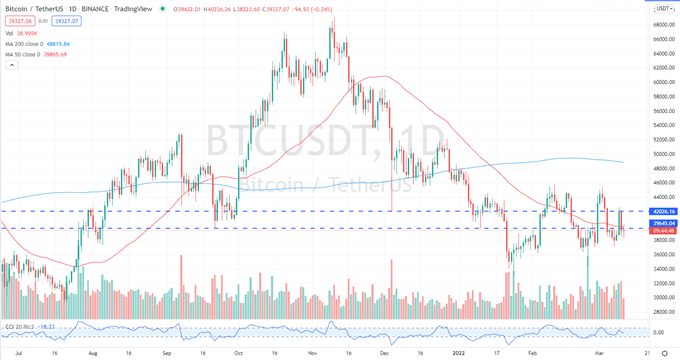
Two important levels of resistance that I have highlighted recently, $39.6k and $42k continue to hold any move higher and both these levels need to be broken conclusively if BTC/USD is able to push back towards the next level of resistance just below $46k. A break above here would turn the outlook for Bitcoin positive. One small positive for BTC is that the recent run of lows has been pushing slowly higher, not in a traditional ‘higher-low’ set-up but more along the lines of a cautious move higher. If sellers are running out of energy at these lows, then confidence in the market may be gradually returning. The CCI indicator sits in the middle of the oversold-overbought range and highlights the current market apathy.
Bitcoin Daily Price Chart – March 11, 2022
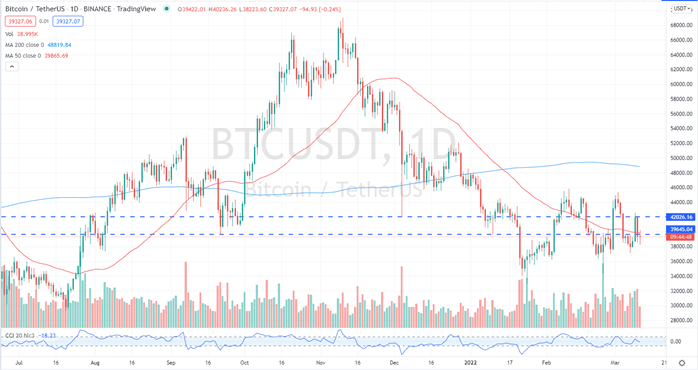
Chart via TradingView
What is your view on Bitcoin – bullish or bearish?? You can let us know via the form at the end of this piece or you can contact the author via Twitter @nickcawley1.