Bitcoin (BTC/USD) Technical Analysis:
- Bitcoin prices slide from technical resistance driving prices back below $17000
- BTC/USD trades in a narrow range as the 20-day MA (moving average) provides support at $16540
- Support and Resistance form between Fibonacci levels of the 2017 – 2018 move but prices remain vulnerable to FTX contagion risks
![]()

Recommended by Tammy Da Costa
Get Your Free Introduction To Cryptocurrency Trading
Bitcoin Prices Slide From Psychological Resistance After a Temporary Retest of $17250
Bitcoin prices are trading in another big zone of technical support and resistance that has formed between Fibonacci levels from the 2017 – 2018 move. With the 23.6% retracement providing support around $15761, the 14.4% fib holds as resistance at $17283.
As the weekly chart below demonstrates the volatile price action that has contributed to both historic and recent moves, a bounce off $15479 has helped ease bearish momentum.
Bitcoin (BTC/USD) Weekly Chart
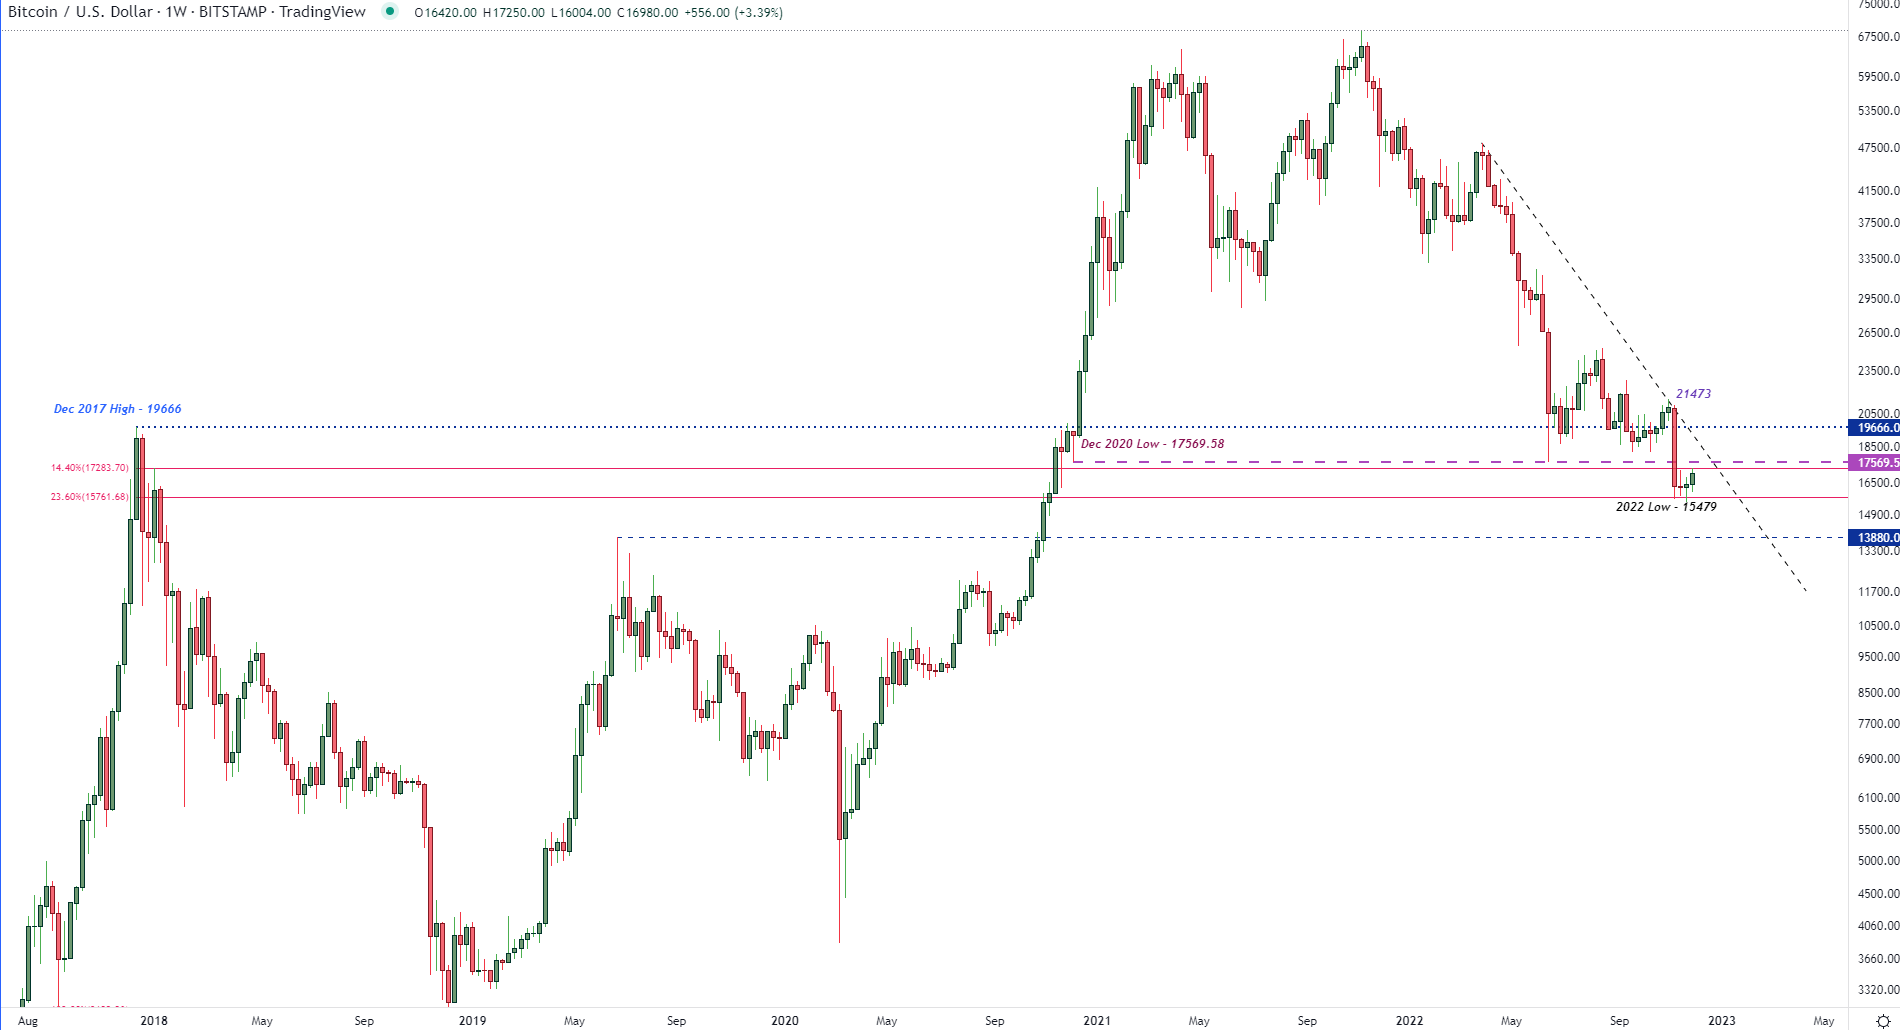
Chart prepared by Tammy Da Costa using TradingView
![]()

Recommended by Tammy Da Costa
What is a range in technical analysis?
While BTC/USD looks to end the week on a positive note, a move above the 20-day MA (moving average) at $16540 has helped support slightly higher prices. As a series of doji candles represents indecision around this zone, a hold above the $17000 psychological handle is necessary to drive bullish momentum. As the current daily high rests at $17250, further upside could see the next barrier of resistance at the December 2020 low of $17569.58.
Visit DailyFX Education to Learn How to Determine a Bull or Bear Market
Bitcoin (BTC/USD) Daily Chart
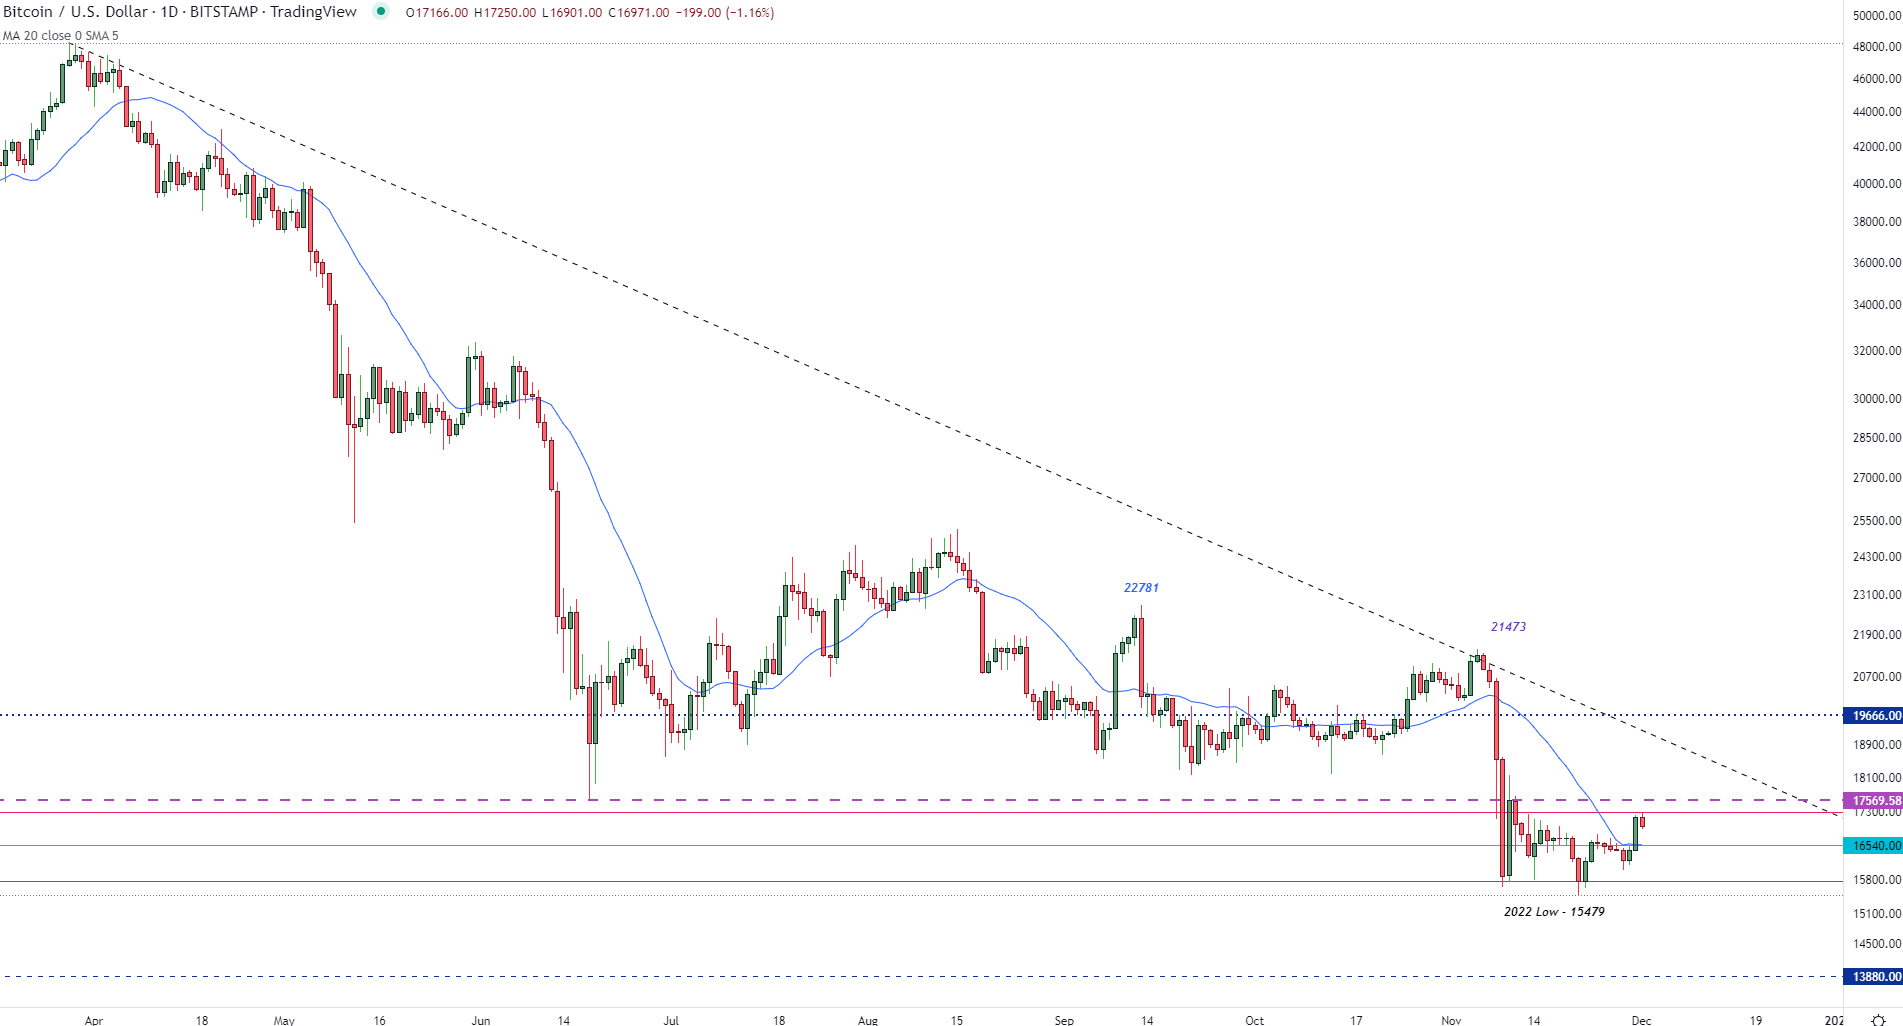
Chart prepared by Tammy Da Costa using TradingView
However, given the vulnerability of the industry to potential FTX contagion, a retest of $16000 and a move below $15479 could pave the way for bearish continuation potential towards the June 2019 high of $13880.
— Written by Tammy Da Costa, Analyst for DailyFX.com
Contact and follow Tammy on Twitter: @Tams707