Dow Jones, S&P 500, Powell Testimony – Asia Pacific Market Open:
- Dow Jones, S&P 500 plunge after Jerome Powell testimony
- The chair of the Fed offered an increasingly hawkish view
- Markets are starting to favor 50-basis point hike this month
- Asia-Pacific markets are bracing for volatility on Wednesday
Recommended by Daniel Dubrovsky
Get Your Free Equities Forecast
Asia-Pacific Market Briefing – Markets Bracing After Wall Street Volatility
Wall Street received a reality check on Tuesday as the Dow Jones and S&P 500 sank 1.72% and 1.53%, respectively. The key culprit was what traders were anxiously anticipating, testimony from Federal Reserve Chair Jerome Powell before the Senate Banking Committee.
The key takeaway from Mr. Powell was that he noted that the central bank was prepared to speed up the pace of hikes again if warranted. Of course, this would continue to be influenced by incoming economic data. Furthermore, he noted that the Fed is likely looking at a higher rate peak than expected.
This testimony follows recent signs that inflation might be stickier than previously seen. The latest CPI and PCE report (the latter of which is the central bank’s preferred inflationary gauge) showed signs that the pace of disinflation slowed.
By the end of the day, market pricing started to favor a 50-basis point rate hike this month as opposed to 25. Treasury yields soared, sapping the appeal of stocks, inducing classic risk aversion. This leaves Asia-Pacific markets vulnerable heading into Wednesday’s trading session.
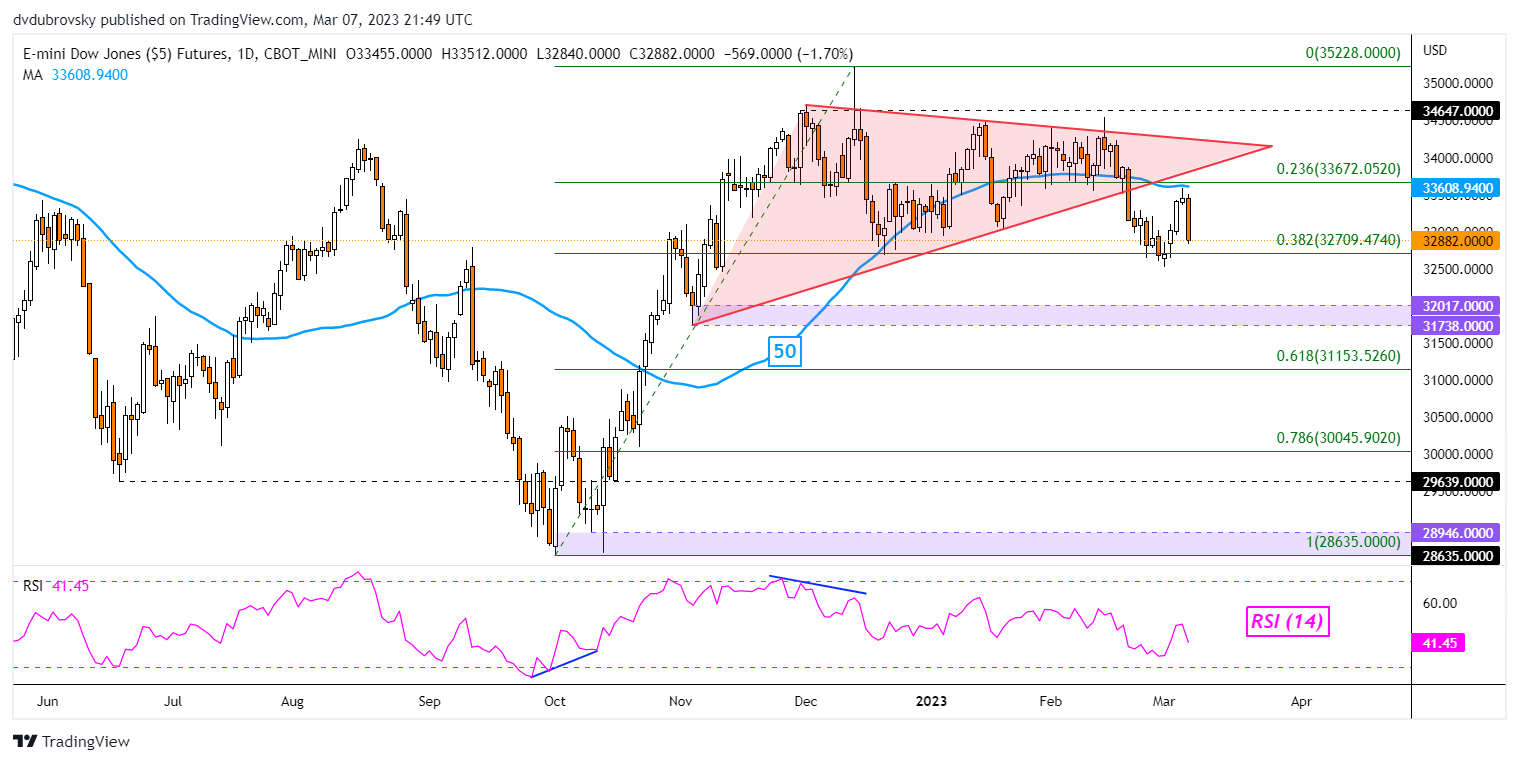
Dow Jones Technical Analysis
The Dow Jones turned lower after rejecting the 50-day Simple Moving Average (SMA). This also followed a breakout under a Symmetrical Triangle chart formation. This is placing the focus on immediate support, which is the 38.2% Fibonacci retracement level at 32709.
Recommended by Daniel Dubrovsky
Get Your Free Top Trading Opportunities Forecast
Daily Chart
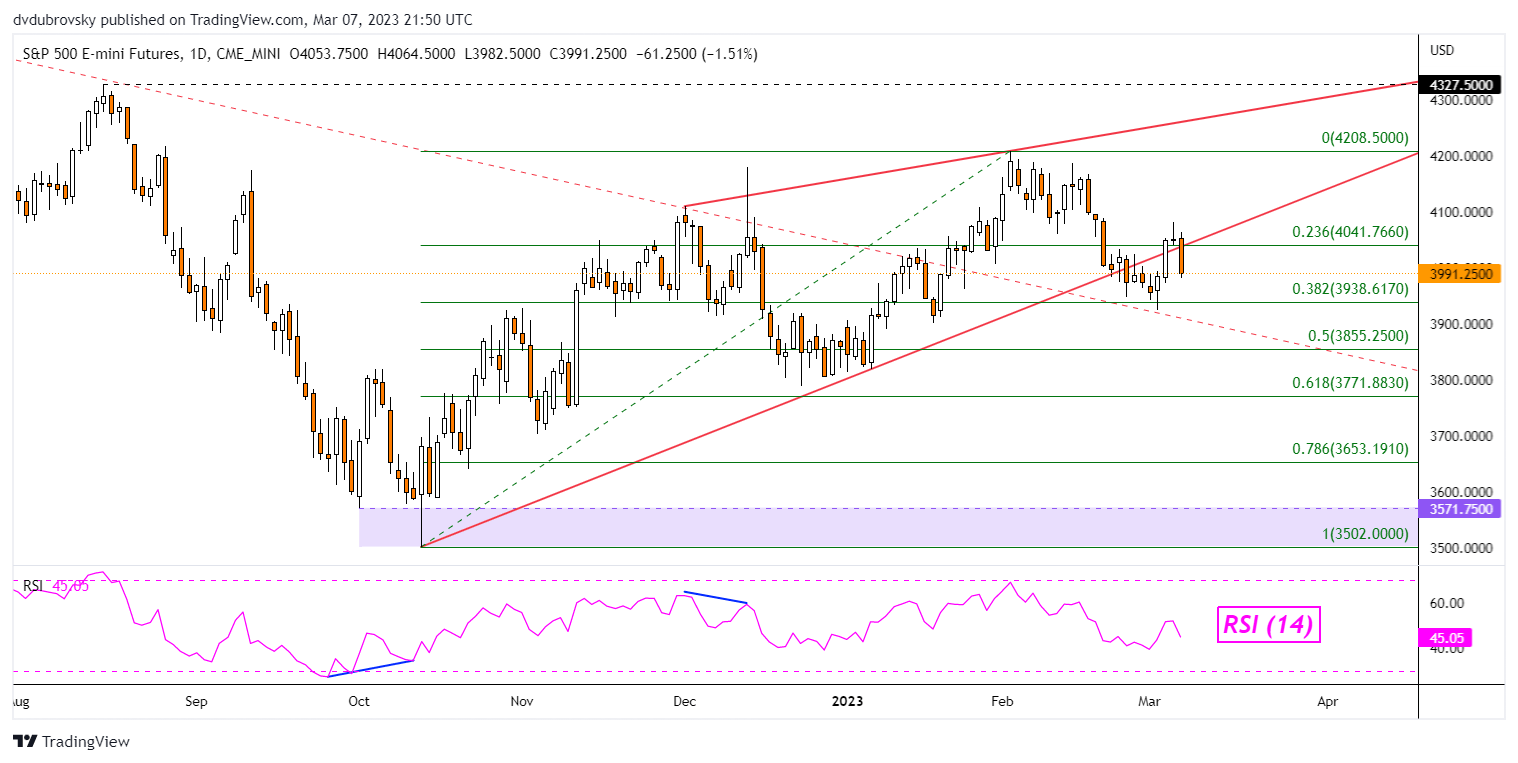
S&P 500 Technical Analysis
Meanwhile, the S&P 500 rejected the ceiling of a bearish Rising Wedge chart formation. This is leaving the index also facing the 38.2% Fibonacci retracement level, which here is sitting at 3938.61. Confirming a breakout under the latter would open the door to an increasingly bearish technical bias.
Daily Chart
— Written by Daniel Dubrovsky, Senior Strategist for DailyFX.com
To contact Daniel, follow him on Twitter:@ddubrovskyFX