EUR/USD Talking Points:
- EUR/USD started the week with a bounce in its step and that was quickly stepped on after yesterday’s CPI print out of the United States.
- As I’ve been discussing, the parity level on EUR/USD is a big deal and so far it’s helped to hold bears from a deeper breakdown for about two months. But – it’s not a brick wall and it can be taken-out with enough force. The last time the level was in-play in 2002, it took bulls six months to break-through.
- The next week is heavy risk so the potential for a motivation certainly does exist – tomorrow brings Retail Sales and Friday Consumer Sentiment along with Euro-area inflation. And then the Fed is next week.
- The analysis contained in article relies on price action and chart formations. To learn more about price action or chart patterns, check out our DailyFX Education section.
Recommended by James Stanley
Download our Euro Forecast
EUR/USD is back at the parity handle and we’re now at the two month mark, as the initial test below the big figure was on July 14th.
Interestingly – that move was also driven by a CPI print. In July, CPI for June was released to the tune of 9.1%, surprising markets by coming in at its highest level in 40 years. The knee-jerk reaction was one of USD-strength and EUR/USD put in that first parity break in over 19 years.
But, as I’ve been discussing, a level like parity will often take some time to leave behind and the reason for this is rooted in the very foundation of human psychology, hence the term ‘psychological level.’ The price of .9999 ‘feels’ much cheaper than just two pips below 1.0001. And that relationship spans, so a price of .9900 feels much cheaper than a 1.0100 print. And this is precisely why most retailers end prices in increments of .99 – it feels cheaper, and thus motivates action. If something is cheap, there’s a general proclivity towards buying while something feeling expensive carries a general propensity for selling.
And price moves, in general, take time to accept. This is something many area dealing with at the moment, going to the store and noticing a product that’s 8, 9 or 10% more expensive. This might change your purchasing decisions, right? Unless capital is infinite these changes in prices matter, and this compels different purchasing decisions which can carry a large impact on market pricing.
And in markets, this psychology plays out, as we’ve seen, with EUR/USD having difficulty drawing in many new sellers when price is below parity, when the pair feels or looks cheap on a relative basis.
This is what’s led to the build of the falling wedge formation over the past two months as parity has come into play. Sellers have been more cautious around resistance or at support, leading to a weaker angle on the support trendline of the formation. Meanwhile, sellers had remained very aggressive around resistance or after a bounce, and that led to a more-aggressive angle on the resistance trendline.
And this is why falling wedges are often tracked for reversals – expecting the same lack of motivation from sellers at support to – eventually – lead-in to a bullish reversal.
EUR/USD Daily Price Chart

Chart prepared by James Stanley; EURUSD on Tradingview
EUR/USD Falling Wedge Reversal Falls Flat
The falling wedge reversal in EUR/USD began a week ago, just ahead of an ECB rate decision where the bank was expected to announce their largest rate hike ever at 75 basis points.
EUR/USD poked above parity, temporarily, only to snap back-below right around the European Central Bank rate decision. This was a threatening theme – with markets rebuking the ECB’s attempt to make up some ground on inflation.
But, as I had warned in the aftermath – support was starting to show around prior resistance – as taken from the falling wedge formation.
T hat support from Thursday came-in as a higher-low, which soon led to a higher-high on Friday. That was extended through this week’s open, with yet another higher-high as price came very close to the 1.0200 handle.
And then yesterday’s CPI report dashed all of that as price immediately pushed back to the parity handle.
Recommended by James Stanley
How to Trade EUR/USD
EUR/USD Hourly Chart
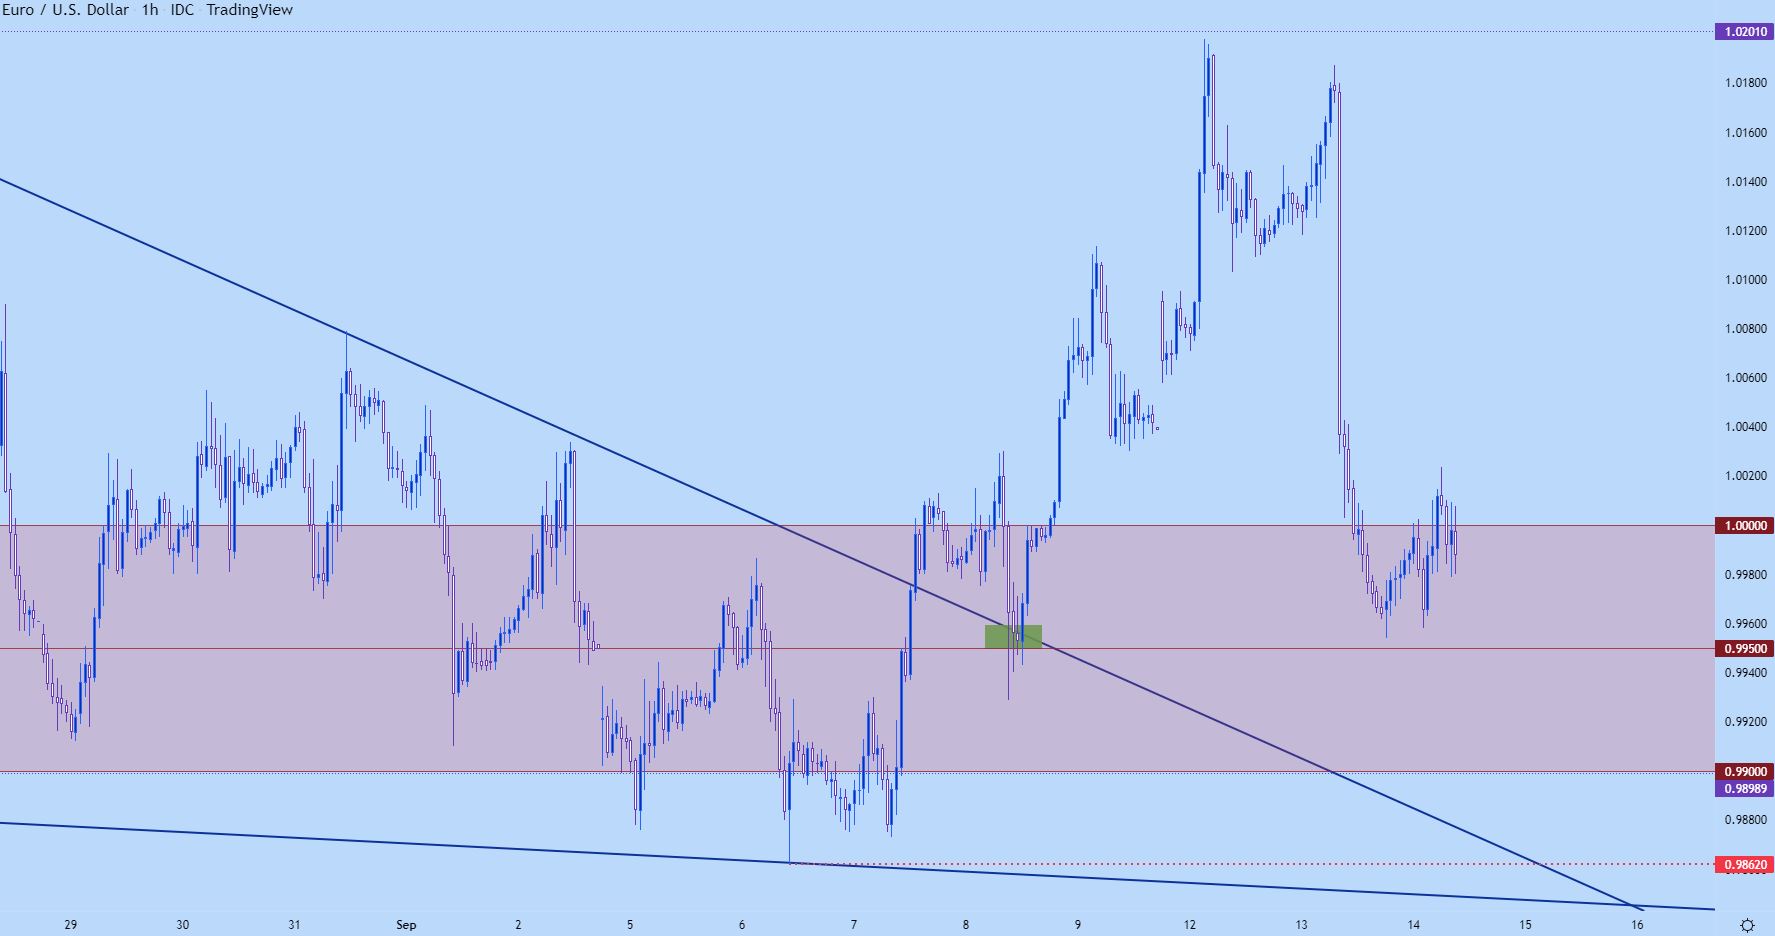
Chart prepared by James Stanley; EURUSD on Tradingview
EUR/USD – Open Door for a Break Given Economic Calendar
Probably the most obvious thing from yesterday’s CPI print was the panic that showed in the immediate aftermath. This isn’t foreign to markets, especially not of late, but it does highlight a continued softening of the ‘buy the dip’ theme that’s been so stubborn around equities. This has some relation with FX markets, as well, as an expected Fed pivot or pause could also be related with a USD-pullback, somewhat similar to what was seen ahead of yesterday’s inflation report.
But, more important than what’s in the past is what lies ahead – and that’s a stocked economic calendar with a lot of drive from some major events. Tomorrow brings retail sales data out of the US, and Euro inflation and Consumer Sentiment follows on Friday. Next week brings the FOMC rate decision and markets are actually anticipating the possibility of a 100 bp hike after yesterday’s CPI print.
On top of all that – next Wednesday is a quarterly meeting from the Fed, which means updated projections. The bank can sent a lot of messages with the dot plot forecast next week and I’m anticipating this being the main driver if we do see a 75 bp hike.
Nonetheless, potential remains around EUR/USD. And given the continued persistence from sellers there could be an open avenue for a bearish breakdown in the pair, although that’ll likely need some continuation of the panic that was seen yesterday and that will probably need some help from the headlines over the next couple of days.
A breach of support in the .9862-.9876 zone leads to fresh 20-year lows in the pair, and .9950 and .9900 remains waypoints along the way to that key support. On the resistance side of the coin, matters are a bit more messy given all of this recent grind around parity. I’m tracking initial resistance from 1.0034-1.0044, after which an area of support-turned-resistance comes into the picture around 1.0100. Beyond that, there’s resistance potential around 1.0200 and then around 1.0275. If buyers can test up there, then 1.0350 comes into the picture and that was a major point of contention back in early-August.
Recommended by James Stanley
The Fundamentals of Breakout Trading
EUR/USD Four-Hour Price Chart
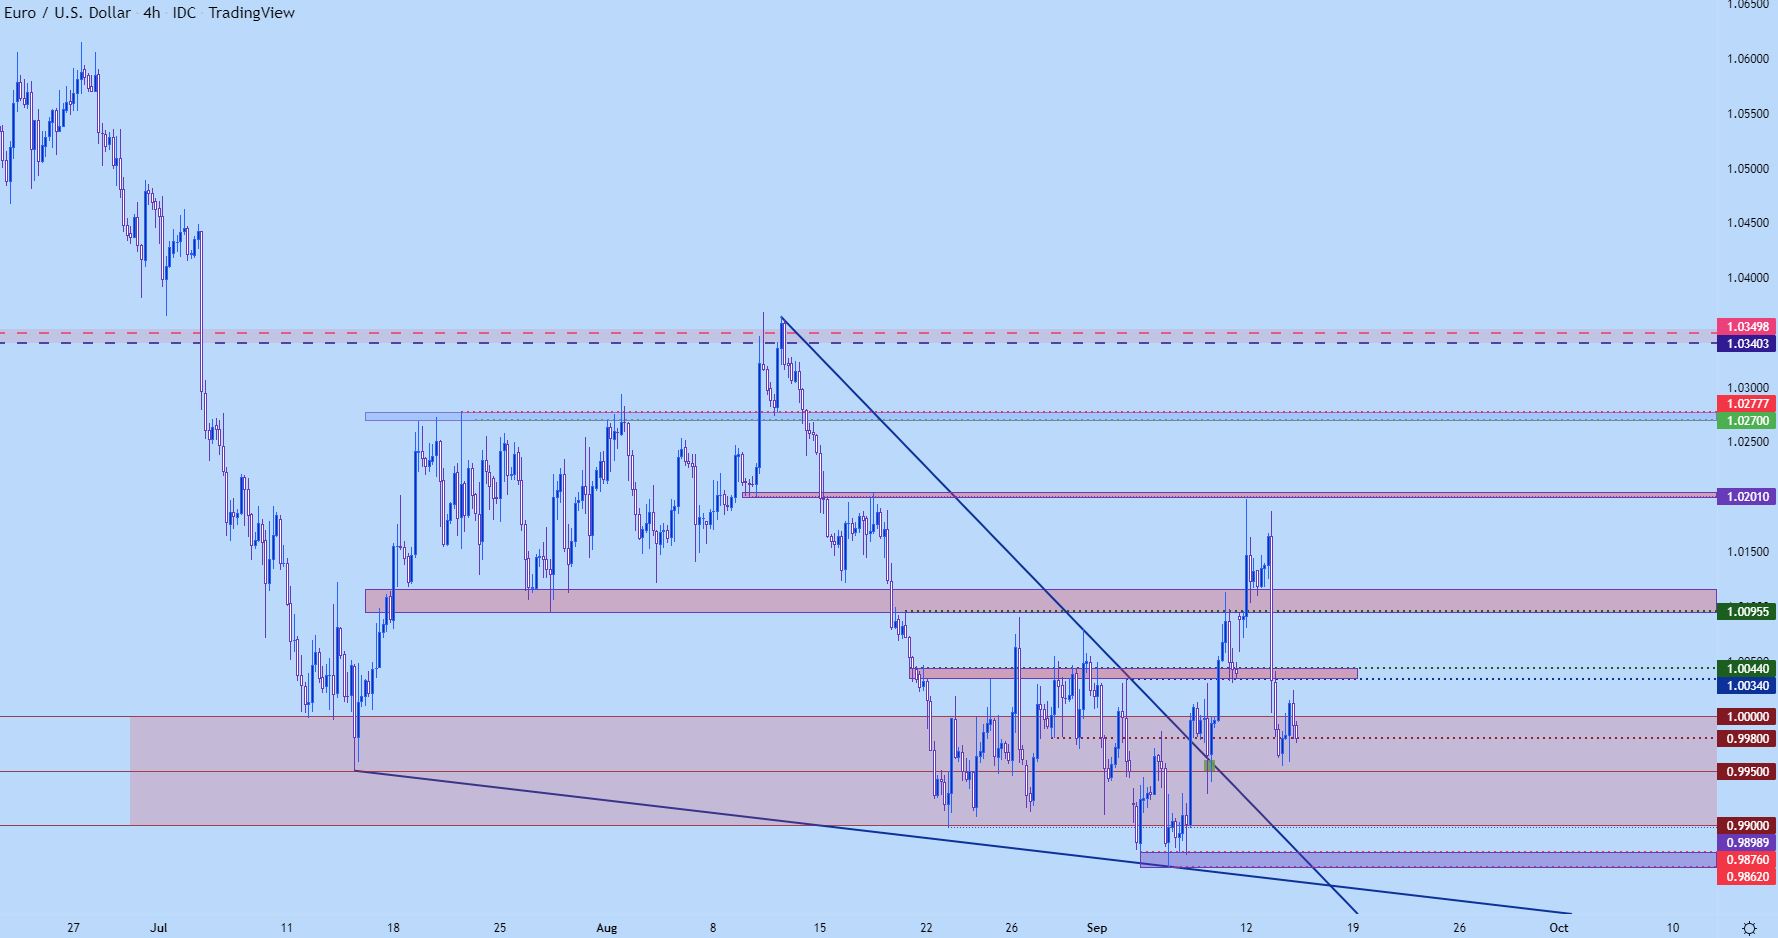
Chart prepared by James Stanley; EURUSD on Tradingview
— Written by James Stanley, Senior Strategist, DailyFX.com & Head of DailyFX Education
Contact and follow James on Twitter: @JStanleyFX