FTSE 100, DAX 40 Prices, Charts, and Analysis
European equity markets are a sea of green today with some indices looking to pull back all of this week’s losses. In what has been a difficult week, led by heavy losses and volatility in the US equity space, it remains to be seen if the current rally is the start of a fresh leg higher or if it is another bear market rally.
For all market-moving data releases and events, see the DailyFX Economic Calendar
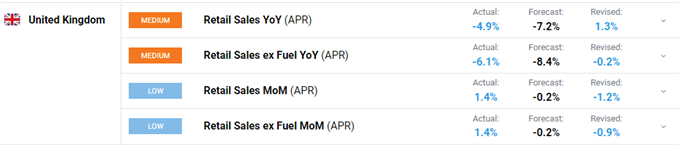
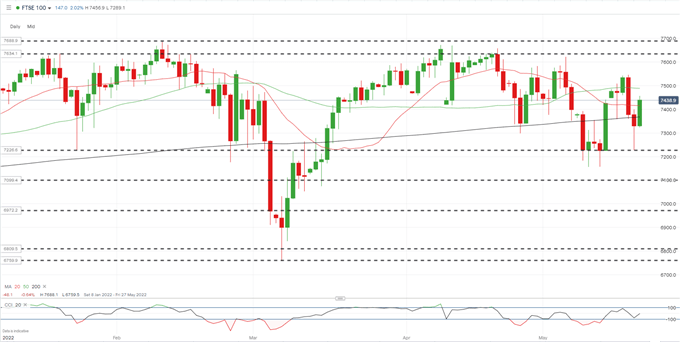
The FTSE 100 is currently showing a daily gain of 2% at 7,440 and is trading and has recouped all of Thursday’s losses. Today’s UK retail sales beat market expectations and while the annual figures remain in negative territory, both monthly figures beat expectations and March’s numbers by a decent margin, with the overall outtake aiding the push higher.

The daily chart shows that the series of lower highs from early April remain in place, giving the chart a negative tone, although this is balanced off by a broken series of lower lows. A confirmed break and close above 7,545 would break the lower high pattern, and put the FTSE above all three simple moving averages, leaving further upside likely. Support is seen at 7,226 and this should provide a stern test for short-term sellers.
FTSE 100 Daily Price Chart – May 20, 2022
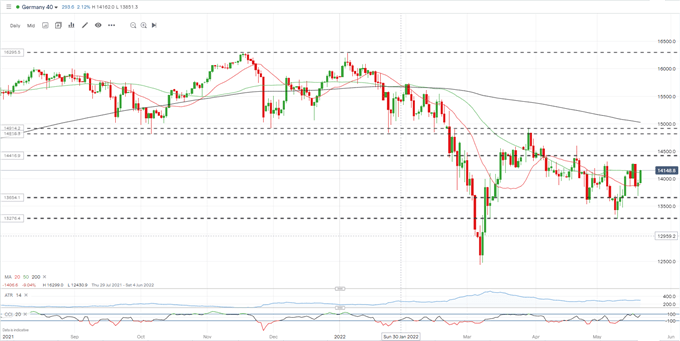
The DAX 40 is now flat on the week after having lost around 500 points mid-week. Thursday’s daily candle produced a bullish hammer pattern and today’s candle currently looks strong and if this holds, it opens the way for further next week. A cluster of recent highs up to 14,605 may slow any move higher towards an important zone between 14,800 and 14,900.
Bullish Hammer Candle Explanation
DAX 40 Daily Price Chart – May 20, 2022
Retail trader data shows 44.86% of traders are net-long with the ratio of traders short to long at 1.23 to 1. The number of traders net-long is 17.95% lower than yesterday and 8.21% lower from last week, while the number of traders net-short is 32.26% higher than yesterday and 25.83% higher from last week.
We typically take a contrarian view to crowd sentiment, and the fact traders are net-short suggests Germany 40 prices may continue to rise. Traders are further net-short than yesterday and last week, and the combination of current sentiment and recent changes gives us a stronger Germany 40-bullish contrarian trading bias.
What is your view on the European Equity Markets – bullish or bearish?? You can let us know via the form at the end of this piece or you can contact the author via Twitter @nickcawley1.