Gold, Fed Funds Forecasts and Recession Talking Points:
- The Market Perspective: Gold Bearish Below 1,780
- Gold has put in for a second, abrupt reversal in just a week’s time – volatile checking that seems to mirror the lack of traction in many major markets
- The Dollar may very well play a key role as the next catalyst for the commodity, but that would make FOMC rate speculation and recession worries top fundamental priorities
Recommended by John Kicklighter
How to Trade Gold
On a technical basis, the implied volatility behind Gold is slowly rounding off of its 2022 lows – the GVZ index has moved up to 16.5 from its 15 lows two weeks ago. On a ‘realized’ basis, however, the average true range (ATR) of the underlying commodity has charged higher to a 1.7 percent level. Activity levels matter more than direction at this juncture given that the market has worked itself into a short-term range between the double top (with the August swing high) around 1,825) down to the 1,780 floor that has been this week’s range low and aligns to the trendline support that began with the November 3rd swing low. That is a 2.6 percent range which doesn’t offer much room to move and would be considered easily broken. However, with the broader markets falling into range in anticipation of major event risk ahead – most notable the FOMC rate decision a week from now – this metal may similarly find clear progress difficult to establish.
| Change in | Longs | Shorts | OI |
| Daily | 0% | 0% | 0% |
| Weekly | -3% | 0% | -2% |
Chart of Gold Futures with 100 and 200-day SMAs and COT Net Speculative Positioning (Daily)
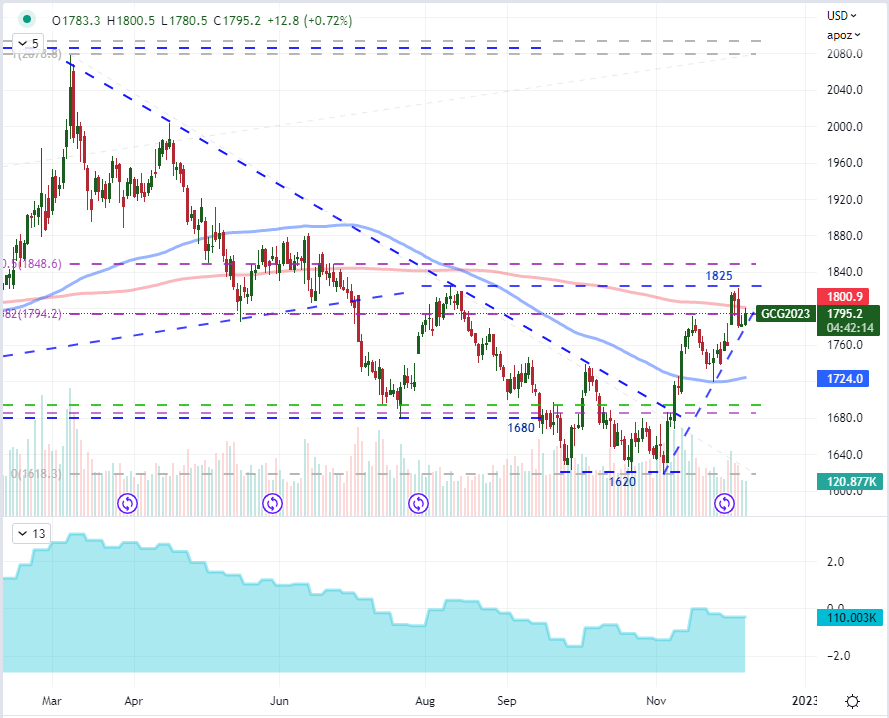
Chart Created on Tradingview Platform
When it comes to the ebb and flow of gold prices, one of the most productive drivers for the commodity is its principal pricing instrument: the US Dollar. Therefore, what drives the Greenback can drive gold. Recognizing the similar price action between the metal and the currency (mirrored), I am focusing on the most highly anticipated event out of the US on the near-term docket: the FOMC rate decision on Wednesday December 14th at 19:00 GMT. There is a general treatment of gold as an alternative to traditional fiat and inflation hedge, which points back to rate expectations. That said, when interest rates are rising or high, the lack of yield to be found on gold can be a detriment. The climb Fed interest rate expectations aligned nicely to the drop in Gold (see below), but the moderation of that advancing path of rates from early November seems to have allowed the metal to seek its relief rally – pushing the 20-day correlation between these two briefly into positive territory. If the Fed stirs rate forecasts to life next week, it can be a catalyst for gold and perhaps even push these two towards convergence.
Chart of Gold Futures Overlaid with Implied Fed Funds Rate for June 2023 Inverted (Daily)
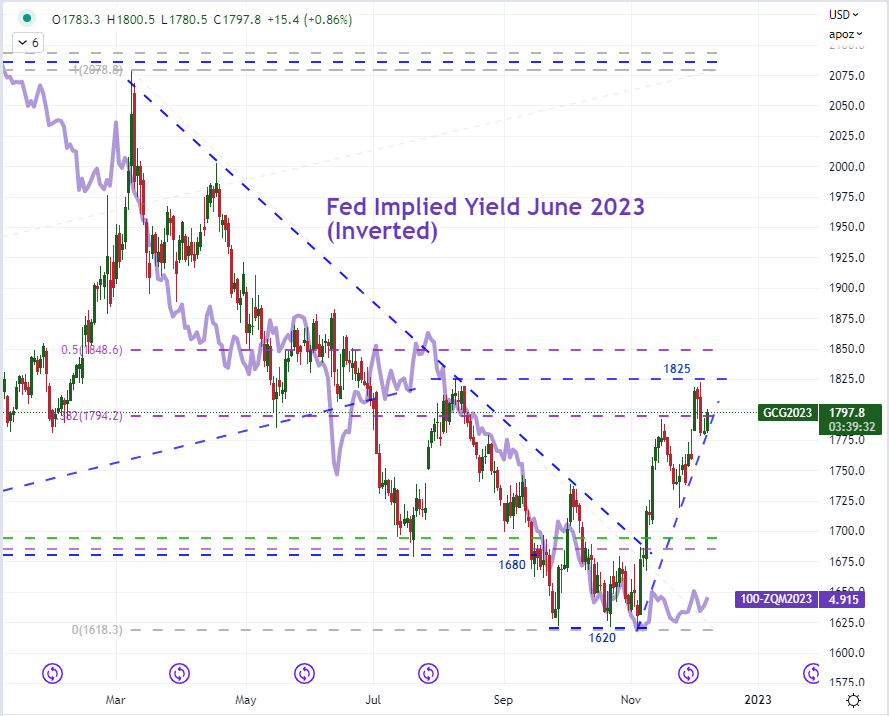
Chart Created on Tradingview Platform
Another theme that hasn’t earned as strong a backing lately is the metal’s safe haven status. That said, the 20-day rolling correlation between the S&P 500 risk benchmark and gold has maintained a consistent and high positive correlation. That would be the opposite of what is expected. That may be because the Dollar which prices the commodity is playing more that role, but the there remains an appeal for this asset as a safe guard in certain economic and financial conditions. Particularly, there is a historical recession hedge appeal for this market. That being said, there is a lot of debate over if/when the US (and possible global) economy will tip into contractionary territory, but the closely observe 2-10 spread (difference of the US 10-year and 2-year Treasury yields) has been pushing into recessionary signaling territory for months now. This is likely a medium-term pressure for the market, but one traders would do well to follow.
Chart of Gold Futures Overlaid with the US 2-Year to 10-Year Treasury Yield Spread Inverted (Daily)
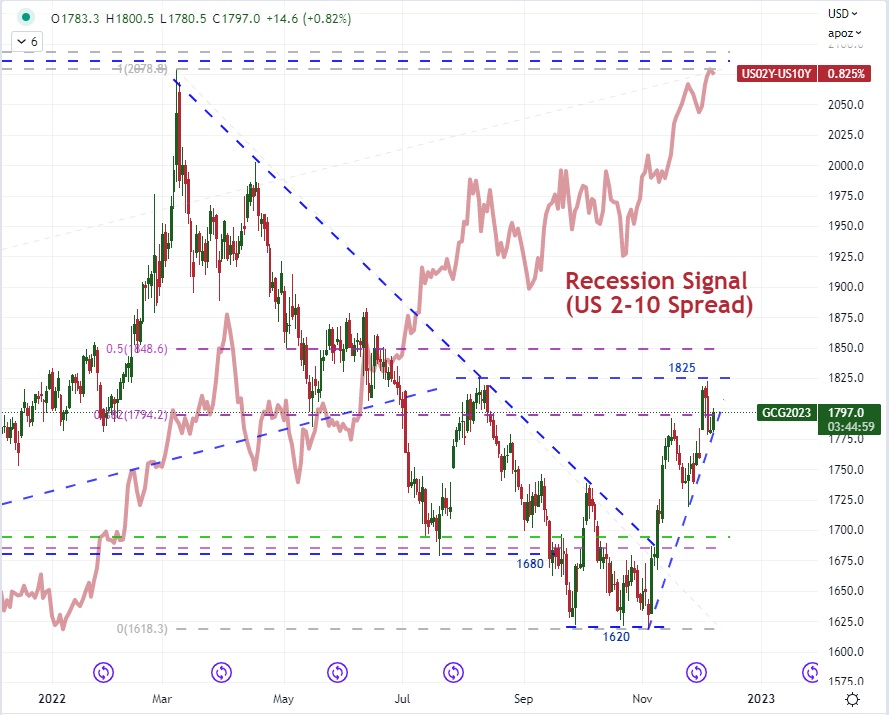
Chart Created on Tradingview Platform
Trade Smarter – Sign up for the DailyFX Newsletter
Receive timely and compelling market commentary from the DailyFX team
Subscribe to Newsletter