Gold, XAU/USD, Treasury Yields, Inflation, Fed – Talking Points
- Gold rises after US CPI misses analysts’ estimates
- Treasury yields fall, allowing bullion to advance
- Markets may have overreacted to inflation miss
- XAU/USD looks to hold above key moving averages
The price of gold rallied overnight following a weaker-than-expected inflation print out of the United States. Core consumer prices – the preferred Fed metric that strips out volatile food and energy prices – rose 4.0% on a year-over-year basis. That was 0.2% below analysts’ expectations, according to a Bloomberg survey. Moreover, the August CPI print showed a slowdown in price growth from July’s 4.3% figure.
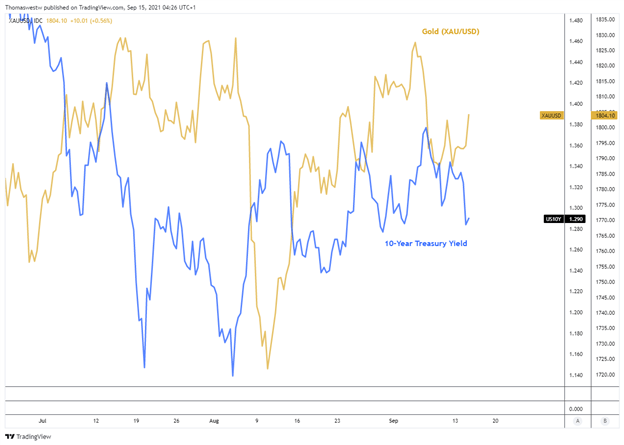
A pullback in Treasury yields provided cover for bullion to advance higher. Markets appear to have taken the easing in inflation pressures as a signal that the Federal Reserve may push back balance sheet tapering in the coming months and extend its super-easy monetary policy – both of which promote government bond-buying. The benchmark 10-year note’s yield fell 4.4 basis points. Lower yields help non-interest-bearing gold prices.

Chart created with TradingView
The 10-year Treasury Inflation-Indexed Security (TIPS) yield shifted lower overnight following the CPI print. Otherwise referred to as real yields, which factor out inflation, they are highly correlated with gold prices. Like with nominal Treasury yields, it is due to the opportunity cost falling for bullion holders when real yields drop; although, that measure is seen as a more accurate holding cost measure.
Overall, gold bulls should be cautious, given that prices remain well above the Fed’s 2% average target. The easing upward pressure on growth surely helps the narrative on the Fed’s view of transitory inflation. Markets may have overreacted on bets whether the Fed will push off tapering. Once the Fed does start tapering its asset purchases, the reduced demand on bonds is all but sure to exert an upward force on yields. That would bode poorly for gold prices.
Gold Technical Analysis:
XAU/USD broke above its 20-day Simple Moving Average (SMA) and the 26-day Exponential Moving Average (EMA) in its overnight move. The 78.6% Fibonacci retracement level (1801.57) from the July/August move also gave way. This follow a breach from the former resistance level from a downward channel in late-August, which now appears to be acting as support. Prices may manage to extend higher if the two respective moving averages hold as support. The 1834.14 level is a major potential resistance level if bulls advance.
XAU/USD Daily Chart
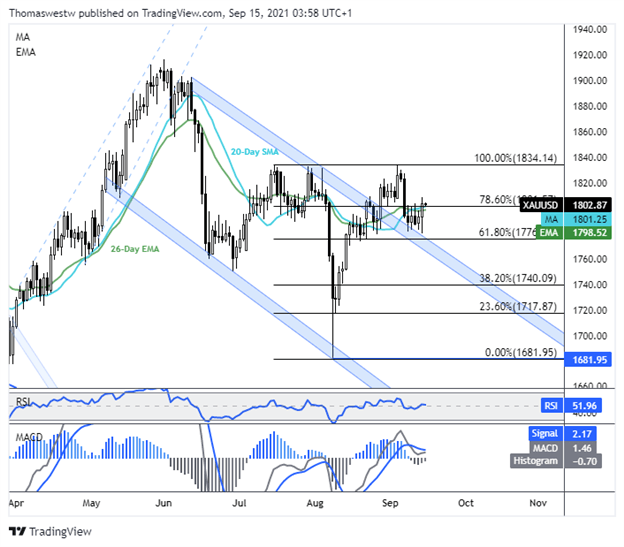
Chart created with TradingView
— Written by Thomas Westwater, Analyst for DailyFX.com
To contact Thomas, use the comments section below or @FxWestwateron Twitter