Gold Price, Charts, and Analysis
- Fed speakers may provide fresh market guidance.
- The precious metal remains supported.
Recommended by Nick Cawley
Get Your Free Gold Forecast
Most Read Gold Price Latest – $2,000/oz. Support Stands Firm as US Inflation Report Nears
For all market-moving data releases and events, see the DailyFX Economic Calendar
Gold starts the week on the front foot after testing $2k support in the last couple of sessions. The precious metal continues to respect this level and with little in the way of high-impact economic data on the calendar this week, traders will look to commentary from a host of Federal Reserve speakers this week to provide some volatility. Today sees scheduled commentary from Fed members Bostic, Kashkari, Barkin, and Cook, while other board members speak throughout the week. The highlight of the week comes on Friday when Fed chair Jerome Powell is scheduled to speak at the Thomas Laubach Research Conference. According to the Fed’s website, this year’s conference will ‘highlight key issues in monetary policy and the economy and facilitate discussions on the challenges faced by monetary policymakers’.
This week’s Fed commentary will be closely followed by US Treasury traders for any clues about the central bank’s intentions going forward. According to one closely watched indicator, the Fed has finished tightening monetary policy and will start cutting interest rates at the end of the third quarter. This outlook is at odds with some of the more hawkish Fed members who continue to press their case for further rate hikes in the months ahead. The rate-sensitive US 2-year is currently trading with a yield of 4%, while the benchmark US 10-year changes hands at 3.48%.
The precious metal remains bid above $2,000/oz. level and is looking to break back above Friday’s $2,022/oz. high. While support has held, a recent series of lower highs has compressed the price of gold, hinting at a breakout. Gold is being supported by the 20-day simple moving average, although this indicator remains under threat. If the 20-dma and the $2k level break then a cluster of prior lows down to $1,970/oz. should provide support.
Gold Price Daily Chart – May 15, 2023
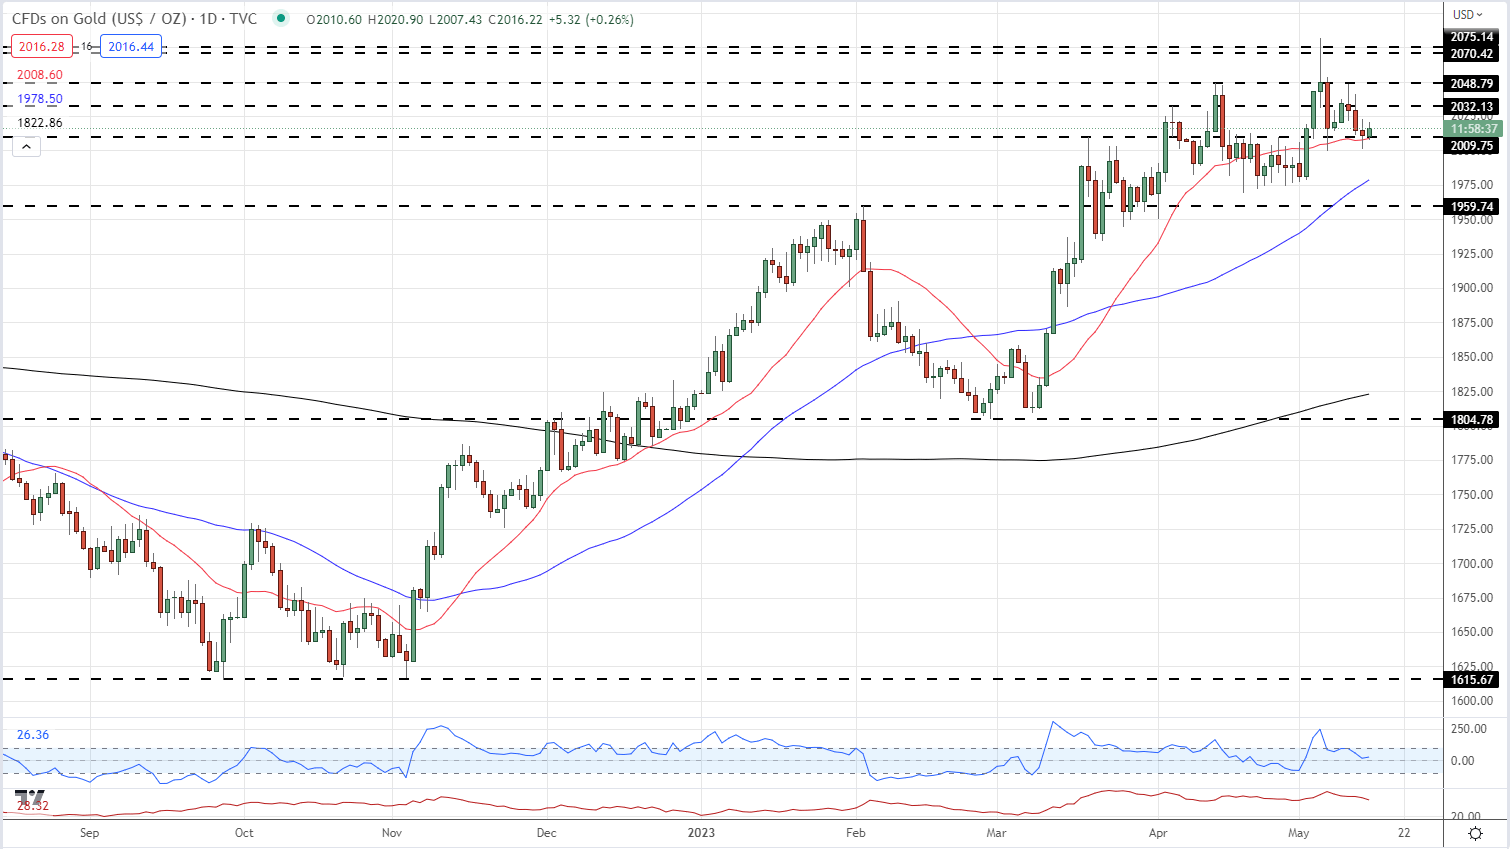
Chart via TradingView
| Change in | Longs | Shorts | OI |
| Daily | 4% | 7% | 5% |
| Weekly | 3% | -3% | 1% |
Retail Traders’ Positioning Little Changed
Retail trader data show 58.03% of traders are net-long with the ratio of traders long to short at 1.38 to 1.The number of traders net-long is 0.94% higher than yesterday and 4.42% higher from last week, while the number of traders net-short is 1.09% lower than yesterday and 4.99% lower from last week.
We typically take a contrarian view to crowd sentiment, and the fact traders are net-long suggests Gold prices may continue to fall. Traders are further net-long than yesterday and last week, and the combination of current sentiment and recent changes gives us a stronger Gold-bearish contrarian trading bias.
What is your view on Gold – bullish or bearish?? You can let us know via the form at the end of this piece or you can contact the author via Twitter @nickcawley1.