
GOLD PRICE OUTLOOK:
- Gold prices down with stocks after US consumer confidence data disappoints
- Risk-off flows face few barriers from barebones economic, earnings calendars
- Technical positioning hints gold upswing from late June might have topped
Gold prices fell alongside stocks on Friday as a disappointing US consumer confidence survey from the University of Michigan sent markets scrambling. The headline sentiment gauge unexpectedly dropped to a five-month low.
As noted ahead of the release, rising prices emerged as a key concern. The survey’s tracking of one-year inflation expectations put the projected rate at 4.8 percent, the highest in 13 years. Shares fell and haven demand buoyed the US Dollar, applying pressure on perennially anti-fiat bullion.
The downbeat tone has extended through the weekend, souring investors’ mood at the weekly Asia-Pacific trading open. Regional shares are down over 1 percent. Futures tracking bellwether European and US equity indexes are pointing meaningfully lower too, signaling that more of the same may be ahead.
A barebones offering on the data docket offers few stumbling blocks to derail momentum. Second-quarter results from IBM headline a similarly bare-bones earnings calendar. If that leaves the door open for risk-off flows to continue driving USD upward, gold prices are vulnerable to deeper losses.
GOLD TECHNICAL ANALYSIS – BEARISH REVERSAL BREWING AHEAD?
The upswing traced out from late June lows may be topping. Prices produced a bearish Evening Star candlestick pattern, hinting a downturn may be ahead. Confirmation calls for a daily close back below the 1797.63-1808.40 inflection zone. That could set the stage for a drop to the 1755.50-64.73 area.
A dense resistance block looms just above last week’s high, running all the way up to 1870.75. If buyers reassert the upper hand, a daily close above this barrier may set the stage for another push through the 1900/oz figure to challenge June’s high at 1916.53.
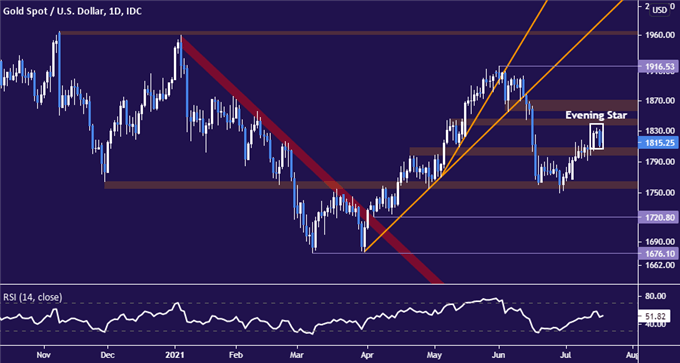
Gold price chart created using TradingView
GOLD TRADING RESOURCES
— Written by Ilya Spivak, Head Strategist, APAC for DailyFX
To contact Ilya, use the comments section below or @IlyaSpivak on Twitter