Gold Price (XAU/USD) Analysis, Price, and Chart
- The Fed is looking set to leave interest rates unchanged next week.
- Hefty US T-Bill issuance may push short-term rates higher.
Recommended by Nick Cawley
How to Trade Gold
For all market-moving data releases and events, see the DailyFX Economic Calendar
Gold extends Friday’s post-NFP sell-off and is testing a cluster of recent lows that if broken will leave the precious metal vulnerable to further losses. The US dollar is pushing higher despite a growing feeling in the market that the Federal Reserve will not raise rates at this month’s FOMC meeting, instead deciding to pause and watch incoming data over the next few weeks.
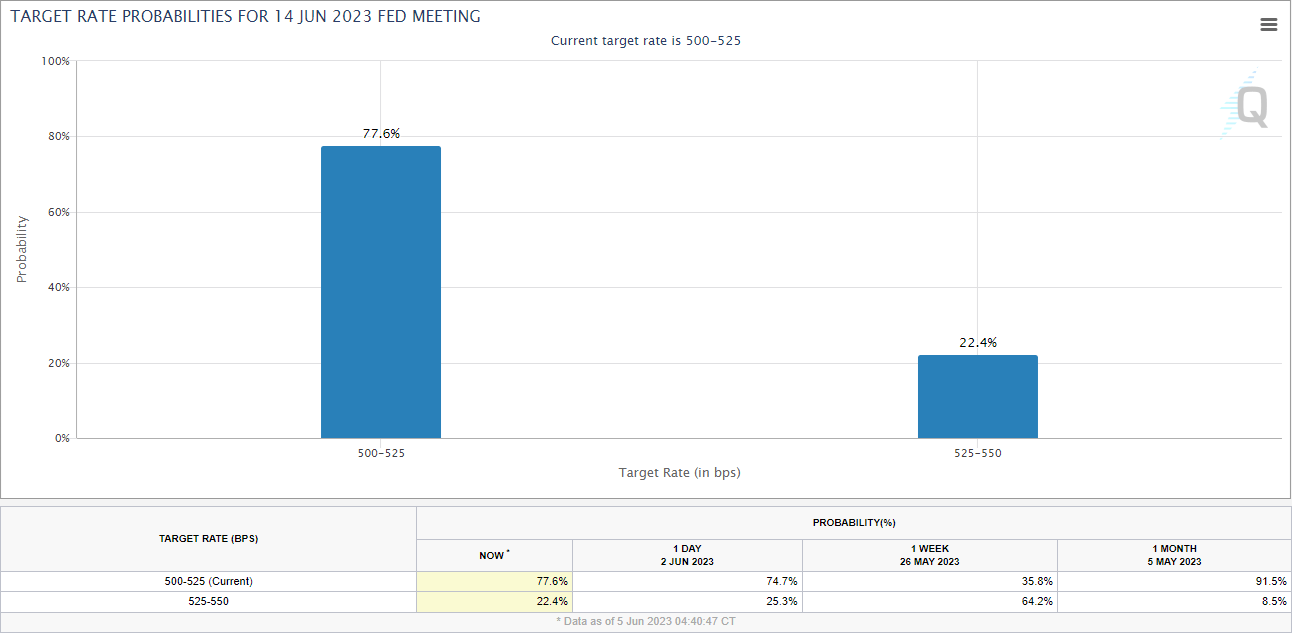
The latest CME Fed Fund probabilities point to a pause at the FOMC meeting on June 14. The market is pricing a 77.6% probability of a pause with a 22.4% probability of a 25 bp hike. One week ago the market was pricing a 35.8% probability of a pause and a 64.2% probability of a quarter-point hike.
With the US debt ceiling now resolved for the next two years, the US Treasury needs to refill their coffers that ran dangerously low at the start of this month. The US Treasury is expected to sell substantial amounts of government bonds to refill the US Treasury General Account, and this will act not just as a drain on market dollar liquidity, but will also drive up yields along the US Treasury curve, as customers demand more for their money. This anticipation of higher yields is weighing on the price of gold.
The price of gold is edging towards a recent multi-week low at $1,932/oz. as short-term yields fears grow. The precious metal remains below both the 20- and 50-dmas and the 23.6% Fibonacci retracement level. Below here the 38.2% Fibonacci level at $1,904/oz, guards the $1,900/oz. big figure level.
Gold Daily Price Chart – June 5, 2023
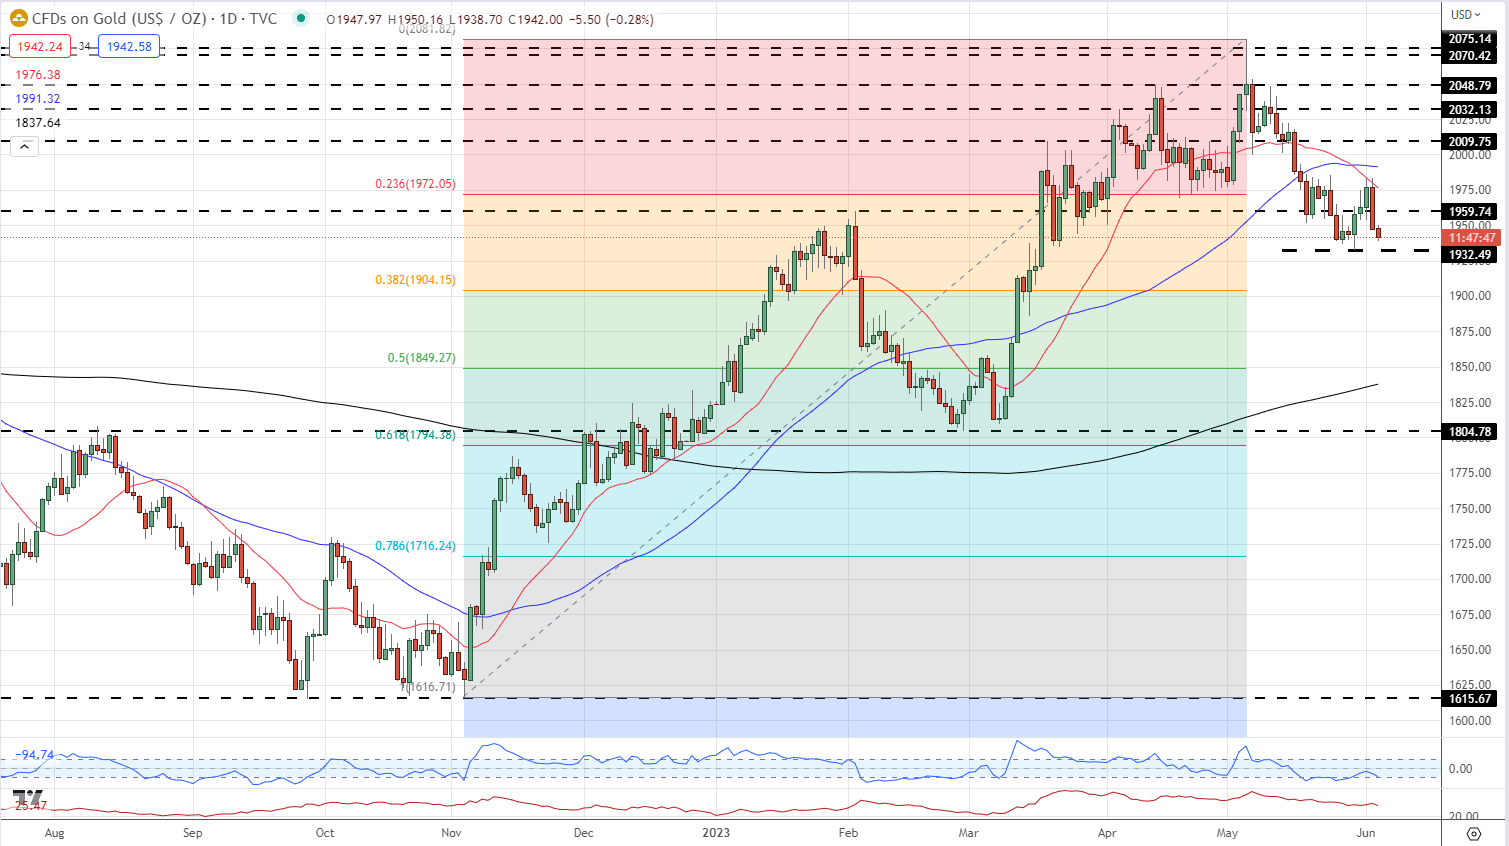
Chart via TradingView
| Change in | Longs | Shorts | OI |
| Daily | 5% | 7% | 6% |
| Weekly | -1% | -5% | -2% |
Retail Traders Remain Long
Retail trader data show 71.73% of traders are net-long with the ratio of traders long to short at 2.54 to 1.The number of traders net-long is 0.05% higher than yesterday and 2.11% lower from last week, while the number of traders net-short is 2.53% higher than yesterday and 6.90% lower from last week.
We typically take a contrarian view to crowd sentiment, and the fact traders are net-long suggests Gold prices may continue to fall. Positioning is less net-long than yesterday but more net-long from last week. The combination of current sentiment and recent changes gives us a further mixed Gold trading bias.
What is your view on Gold – bullish or bearish?? You can let us know via the form at the end of this piece or you can contact the author via Twitter @nickcawley1.