Nasdaq 100 Price Outlook:
- The Nasdaq 100 has experienced considerable volatility in recent sessions after turbulent price action followed an explosion in retail trading activity
- While volatility could continue, the technical outlook of the tech-heavy Nasdaq 100 is encouraging
- Nasdaq Trading Basics: How to Trade Nasdaq 100
Nasdaq 100 Forecast: Risk Appetite Returns as Retail Traders Relent
The Nasdaq 100 posted a monster session Monday, surging 2.65% to recapture much of the ground forfeited last week. Manic price action still exists in some retail trader favorites like GameStop and AMC, but a distinct decline in short interest in the struggling companies has revealed a remarkably different landscape compared to last week.
Stock Market Forecast for the Week Ahead: Will the Mania Continue?
According to Goldman Sachs, hedge funds bought and sold the most stock in more than 10 years last week which amounted to the most de-grossing since February 2009. While the deleveraging might complicate matters for retail traders with exposure to the stocks popular on Reddit, extra cash on the sidelines could prove beneficial for the broader indices – especially in an environment where bears are being hunted.
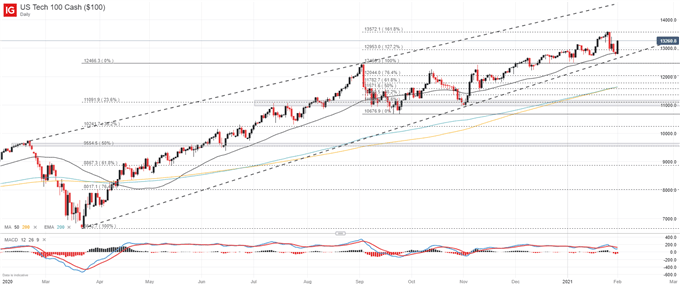
Nasdaq 100 Price Chart: Daily Time Frame (February 2020 – February 2021)
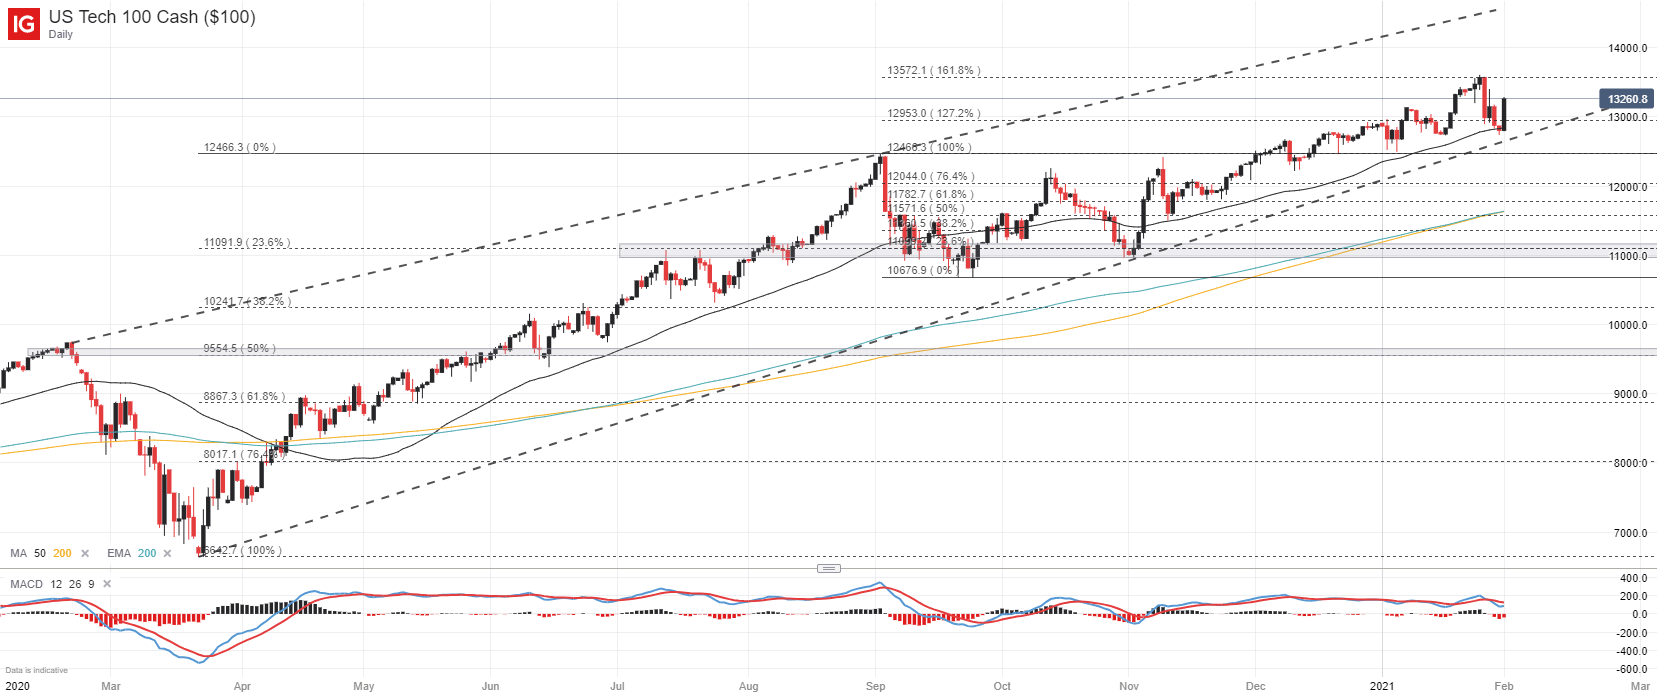
That said, sentiment lies in a precarious position and volatility stands elevated. Given these conditions, wild swings in price might occur for the Nasdaq 100 and its sister indices, but the technical landscape remains constructive. Selling pressures eased at the index’s 50-day moving average last week in an important vote of confidence for the technical level.
Nasdaq 100 Price Chart: 4 – Hour Time Frame (September 2020 – February 2021)
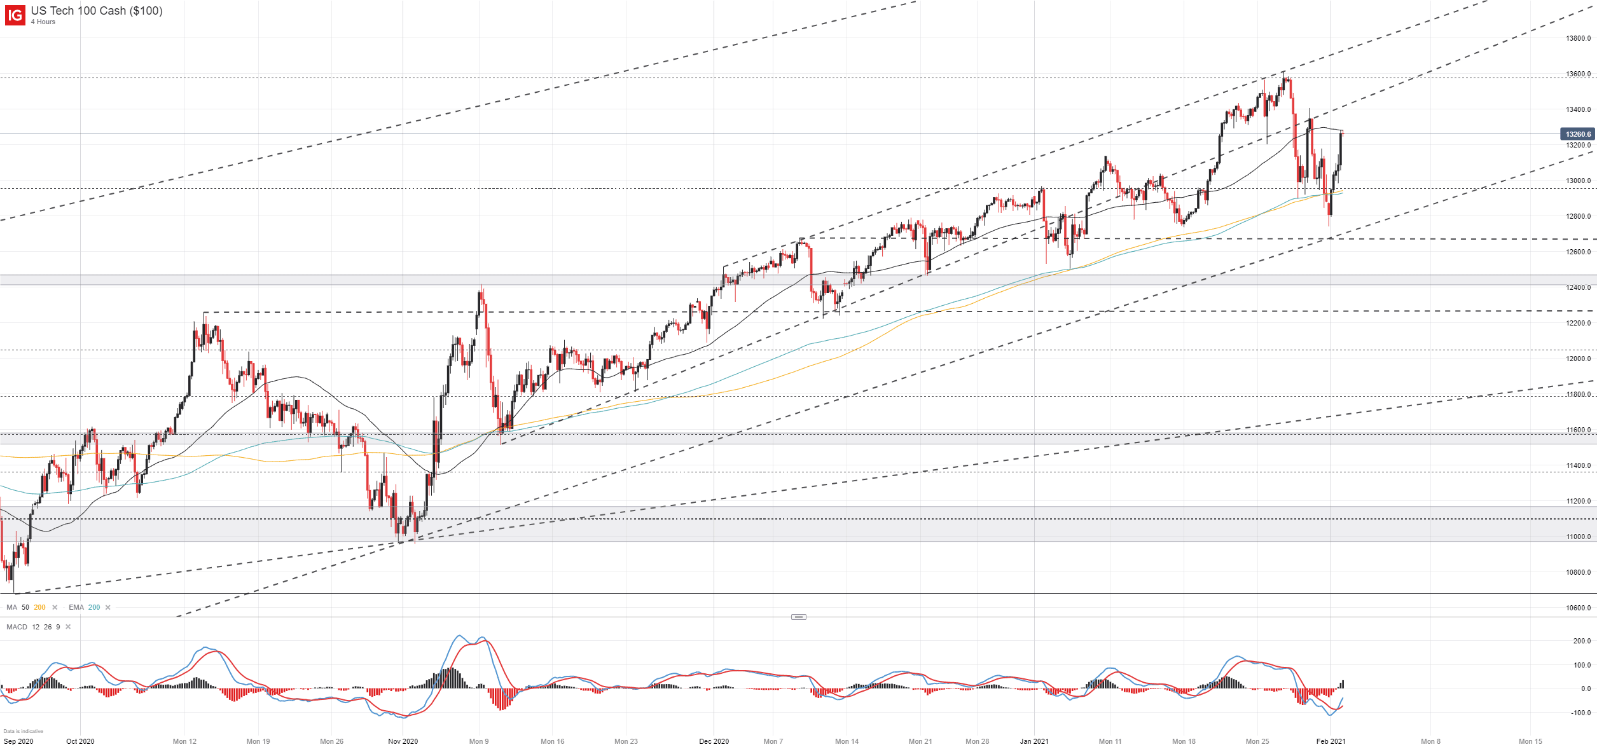
Reversing higher at the 50-day moving average, bears were unable to push the Nasdaq 100 beneath the ascending trendline from March and November which has kept the broader uptrend intact. As a result, the medium to longer-term technical outlooks remain encouraging. Further still, a recent MACD crossover on the 4-hour chart could hint at a potential continuation higher from last week’s lows.

Recommended by Peter Hanks
Get Your Free Top Trading Opportunities Forecast
Key support in the event of bearish resumption stands around the 12,672 mark which denotes the ascending trendline. Secondary support likely resides near 12,400 which can be viewed as the “line in the sand” at this stage. A break beneath 12,400 would likely open the door to further losses and could see selling accelerate. Follow @PeterHanksFX on Twitter for updates and analysis.
–Written by Peter Hanks, Strategist for DailyFX.com
Contact and follow Peter on Twitter @PeterHanksFX