US Dollar Talking Points:
- It’s a morning of extremes as GBP/USD has pushed down for a fresh 37-year-low while USD/JPY has pushed up to another fresh 24-year high.
- EUR/USD comes into focus tomorrow for what’s Christine Lagarde’s most important moment atop the ECB yet, as the European Central Bank tries to stem the bleeding in the single currency which, if unsuccessful, will beget more inflation as the European economy takes another step in a downward spiral. Mario Draghi was in a similar spot in July of 2012 – will tomorrow be Lagarde’s ‘whatever it takes’ moment?
- The analysis contained in article relies on price action and chart formations. To learn more about price action or chart patterns, check out our DailyFX Education section.
Recommended by James Stanley
Download our US Dollar Forecast
The US Dollar is pulling back from a fresh 20-year-high that was set this morning, and this time, the move wasn’t entirely-driven by sellers in EUR/USD. EUR/USD bears have been relatively slow when compared to the bearish price action in the British Pound and the Japanese Yen.
And this is on the heels of a rate hike sell-off in AUD/USD yesterday and another this morning from the Bank of Canada, with CAD giving up ground to the USD despite the fact that the Canadian central bank just kicked rates higher by 75 basis points.
The more compelling moves have been coming from the British Pound and the Japanese Yen. GBP/USD has set a fresh 37-year-low this morning, touching below the 1.1414 low that was set during the initial phase of the pandemic back in 2020. And in USD/JPY, the trend has continued up to yet another fresh 24-year-high with bulls finally slowing down ahead of a test of the 145.00 psychological level.
This all sets the stage for what’s expected to be a widely-watched rate decision from the European Central Bank tomorrow morning.
The ECB is expected to hike rates by either 50 or 75 basis points in a move designed to address inflation. Earlier this month, inflation printed at 9.1% for the Euro-zone and this presents a massive quagmire for the ECB given the weak growth showing in the economy. The ECB needs to address inflation and the ideal way to do so is with rate hikes. But – those rate hikes also threaten to put the Euro-zone in an even more depressed economic state. But – if they don’t hike, and the Euro continues to fall – there’ll be more inflation on the horizon as Europe imports a considerable amount of goods and on a relative basis, a falling Euro would make those imports more expensive. So, more inflation.
USD
At this stage, there’s support potential at prior psychological resistance at the 110.00 handle. If bulls bid that level, the trend would remain as aggressive. Interestingly, the 109.25 area which put in two resistance tests in DXY when price was on the way up hasn’t yet been tested much for support. So, if we do see some position squaring that pulls DXY below 110.00, the spot from the long-term Fibonacci level of 109.14 up to around 109.27 becomes an area of interest for longer-term higher-low support potential.
US Dollar Four-Hour Chart
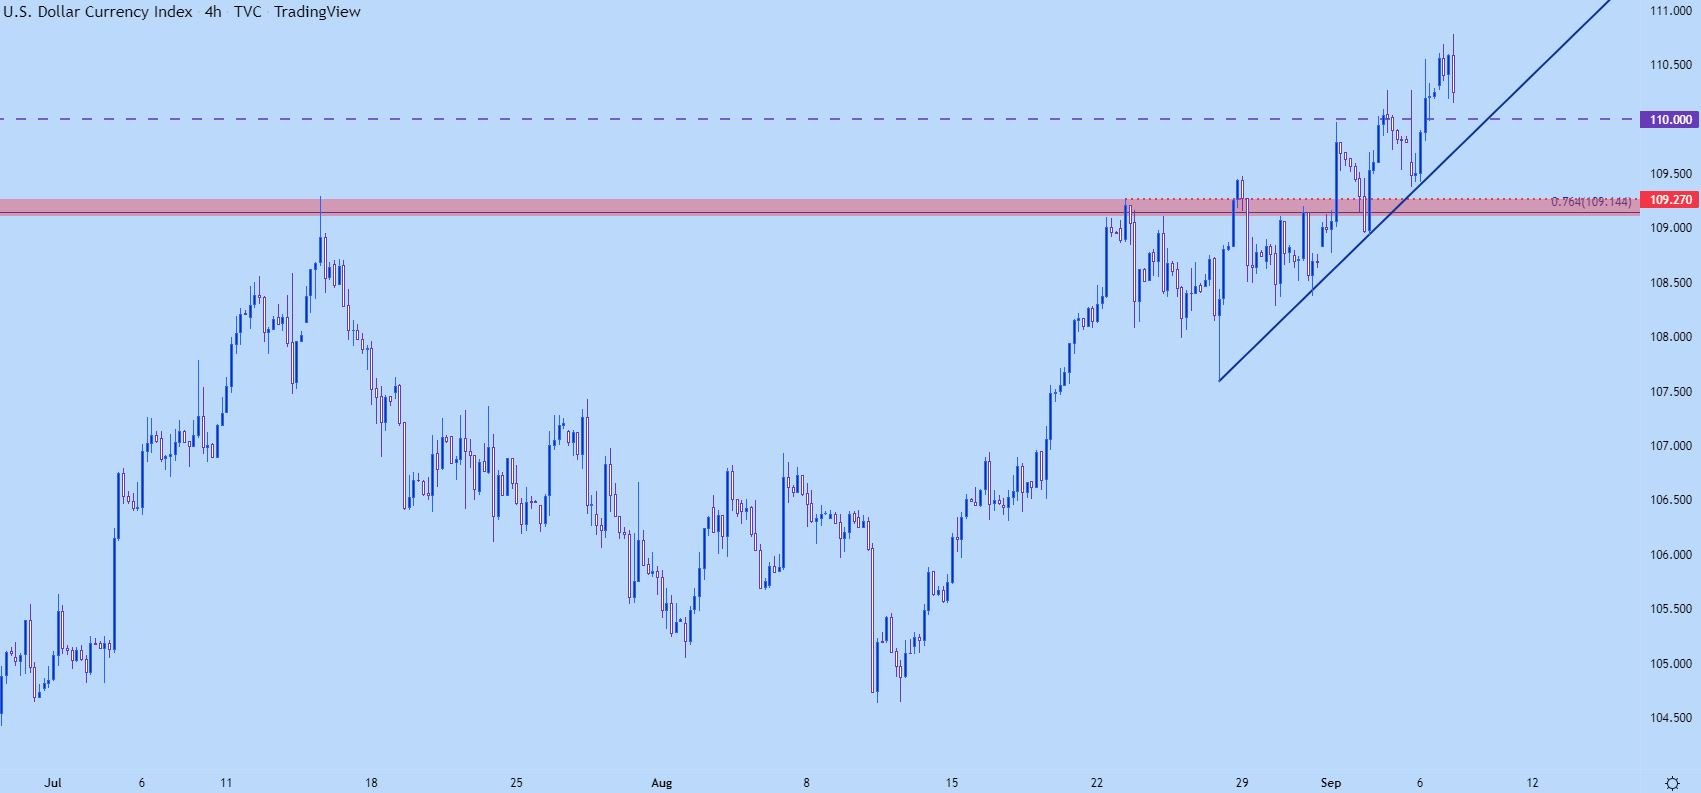
Chart prepared by James Stanley; USD, DXY on Tradingview
EUR/USD – The Counter Thesis
If Lagarde is able to inject some confidence behind the Euro tomorrow, I’d expect a deeper pullback in the USD as shorts in EUR/USD unwind – or at least square up. Whether this would be sustainable or something that will last long-term, such as Draghi’s ‘whatever it takes’ pledge will remain to be seen. But the short move in EUR/USD is so baked in the cake now that even the slightest hint of optimism can compel short-cover, which could lead to a deeper pullback in the USD.
From the longer-term chart, if this scenario takes place, there’s support potential at prior price action swings such as 107.79, 106.81 or the psychological level of 105.
US Dollar Daily Chart
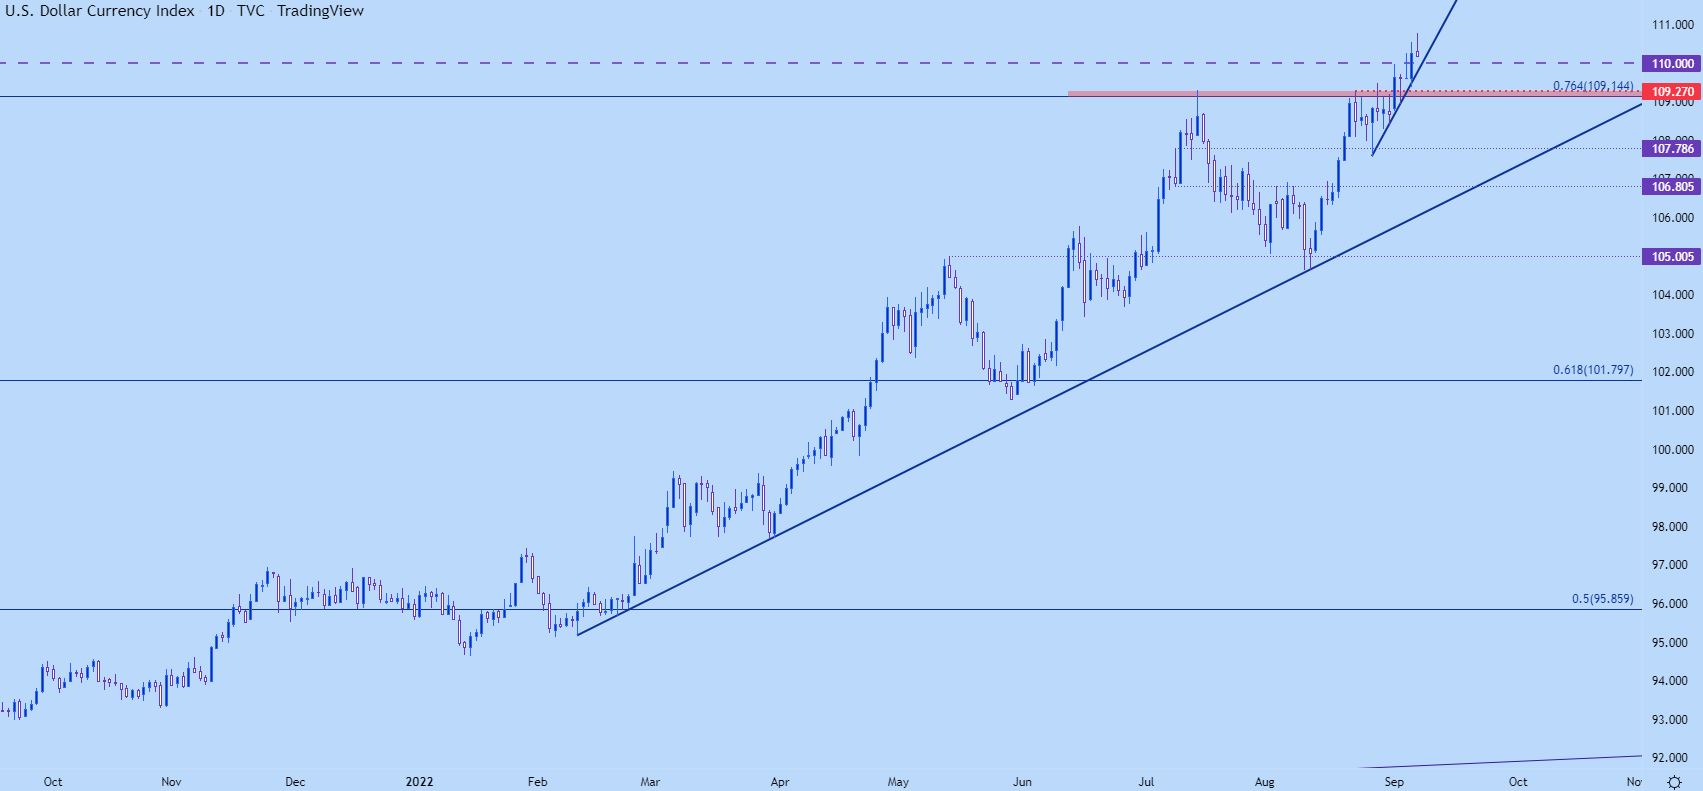
Chart prepared by James Stanley; USD, DXY on Tradingview
EUR/USD
Parity is a big deal in EUR/USD. I learned this from the 2002 episode. Even as prices were bursting-higher as the single currency was gaining widespread acceptance on a global stage, the parity level took about six months to completely leave behind.
And this really speaks to the power of psychological levels.
Parity hasn’t completely deterred sellers at this point, witnessed by the fact that prices are currently sitting just below the big figure. But – it has constrained bearish price action to a degree, which has allowed for the build of a falling wedge formation. Such formations are often tracked with the aim of bullish reversals and they’ll often build for the exact reason that this one has – a long-term level of support that’s constraining bearish price action while sellers remain very aggressive at highs or near resistance.
This sets the technical stage for Lagarde to deliver a strong message tomorrow. But – if she fails to do so, sellers may not be so bashful about selling EUR/USD below parity and that could quickly invalidate the formation.
At this stage, wedge resistance is confluent with the parity handle.
EUR/USD Daily Chart
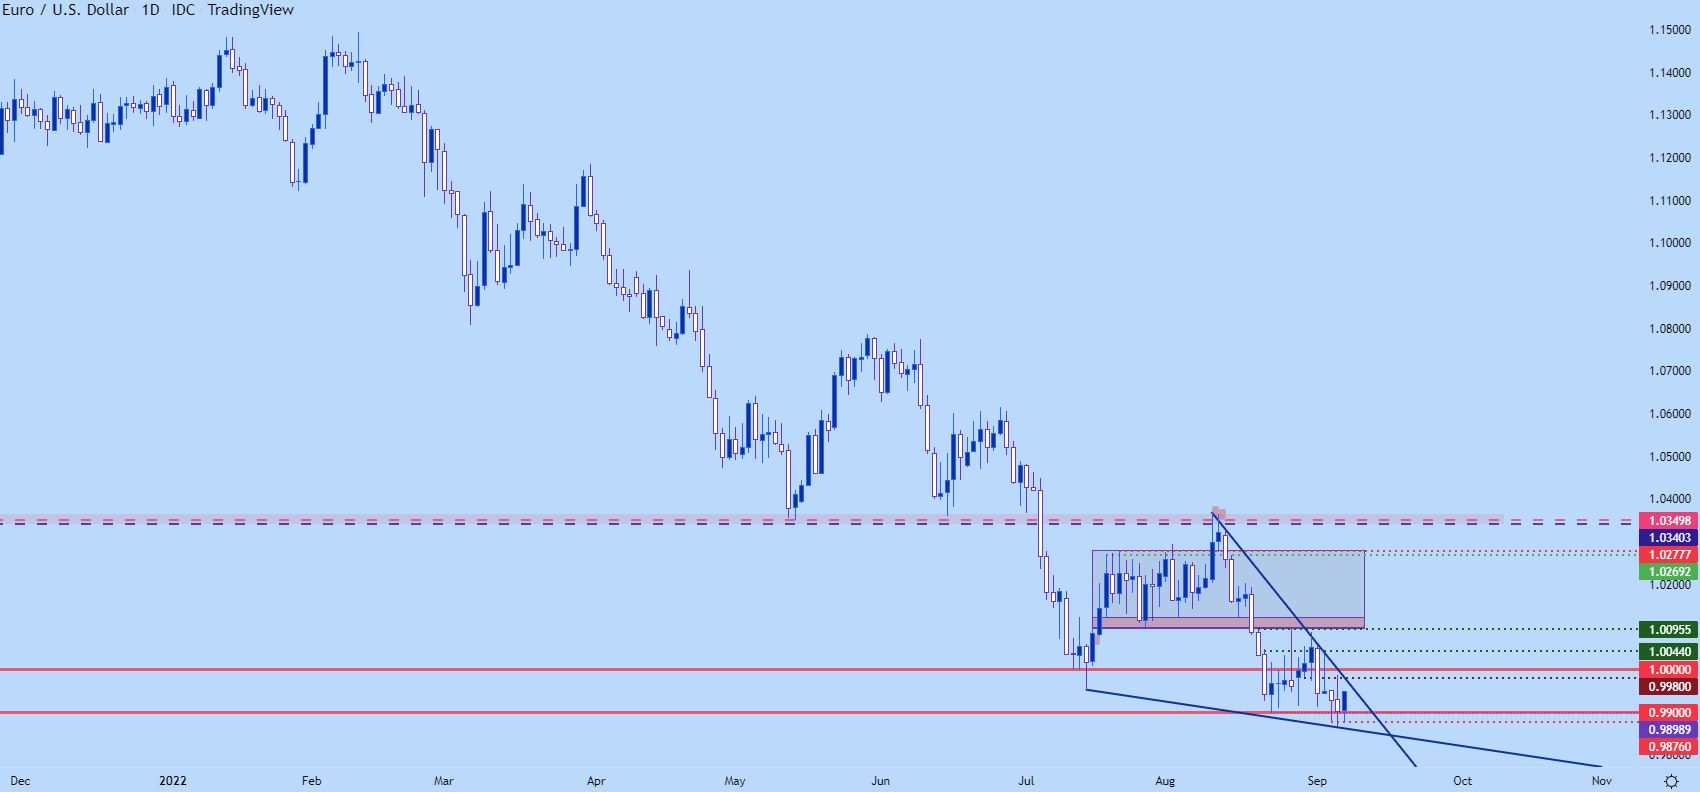
Chart prepared by James Stanley; EURUSD on Tradingview
GBP/USD Fresh 37-Year Lows
The picture in GBP/USD has really darkened over the past month…
As I warned in the middle of August GBP/USD looked like it was preparing to breakdown. And break down it did, and that move continued all the way into this morning when Cable printed a fresh 37-year-low.
A mercy bid has arrived just after prices pushed below 1.1414, which was the low from March of 2020, in the midst of pandemic panic. Prices have popped-higher since but bears appear to be standing at the ready. The next big test will be a re-test of the 1.1500 psychological level, which had provided a shot of support last week and again this week before sellers finally broke it down to fresh lows.
Recommended by James Stanley
Traits of Successful Traders
GBP/USD 30-Minute Chart
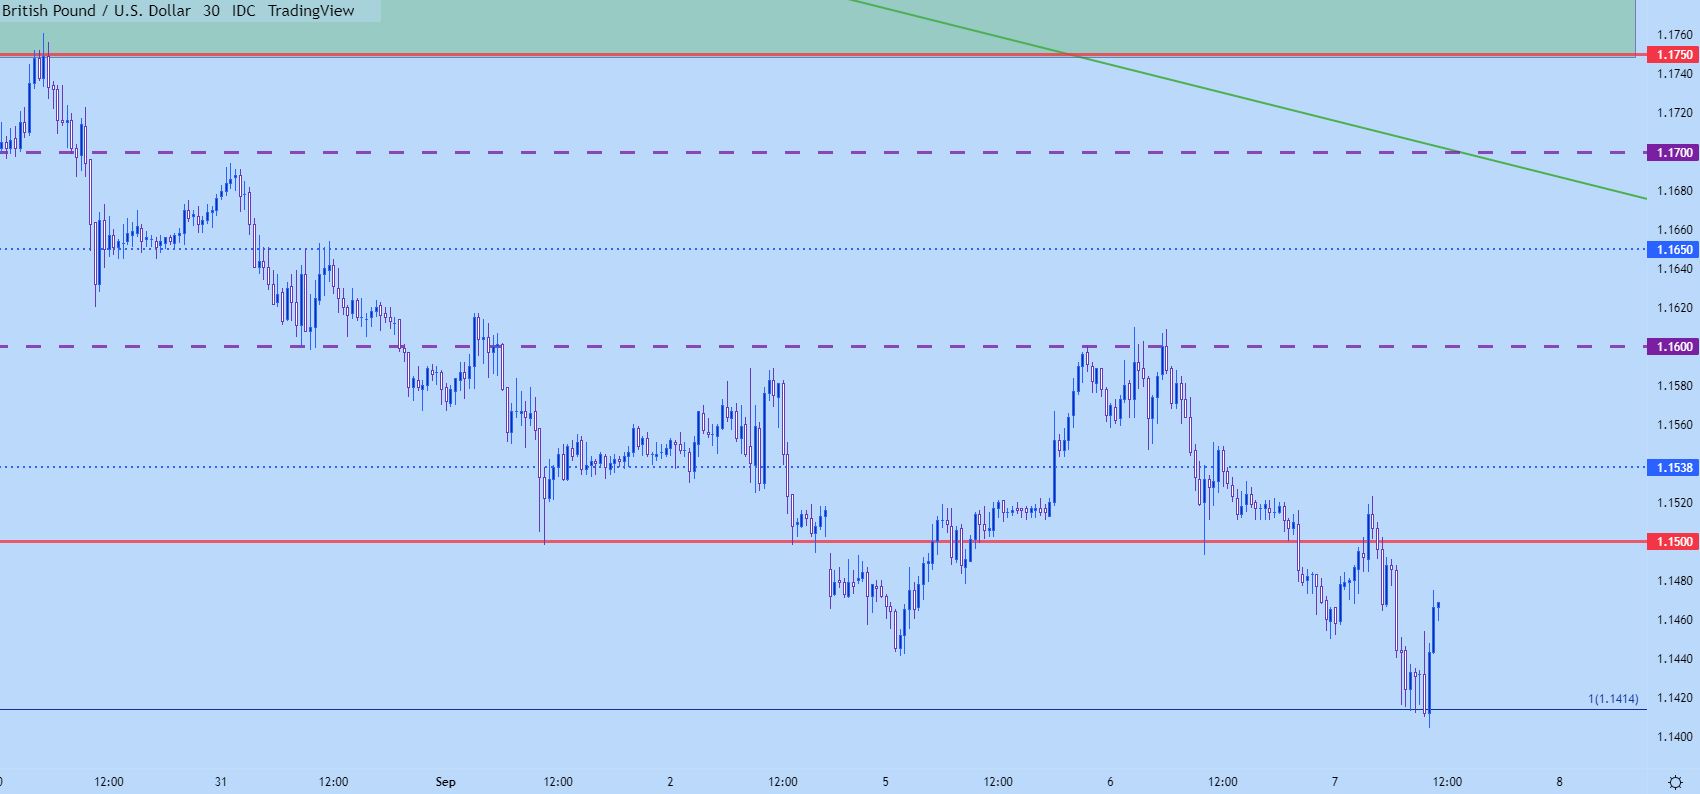
Chart prepared by James Stanley; GBPUSD on Tradingview
USD/CAD
The Bank of Canada put in a 75 basis point hike earlier this morning and in response the Canadian Dollar sold off. This sets up for a really interesting backdrop around USD/CAD at the moment.
As I shared a couple weeks ago, USD/CAD was one of the few majors that diverged from the larger USD-bull theme. While the USD has been tearing away over the past year-plus, USD/CAD has been considerable more tepid and from the weekly chart below, we can notice a clear case of divergence where that USD-strength has been massively constrained.
And there’s even some longer-term bearish potential in the USD/CAD chart, as illustrated by a bear flag formation combined with price action sticking-below the 50% retracement of the 2020-2021 major move.
USD/CAD v/s DXY
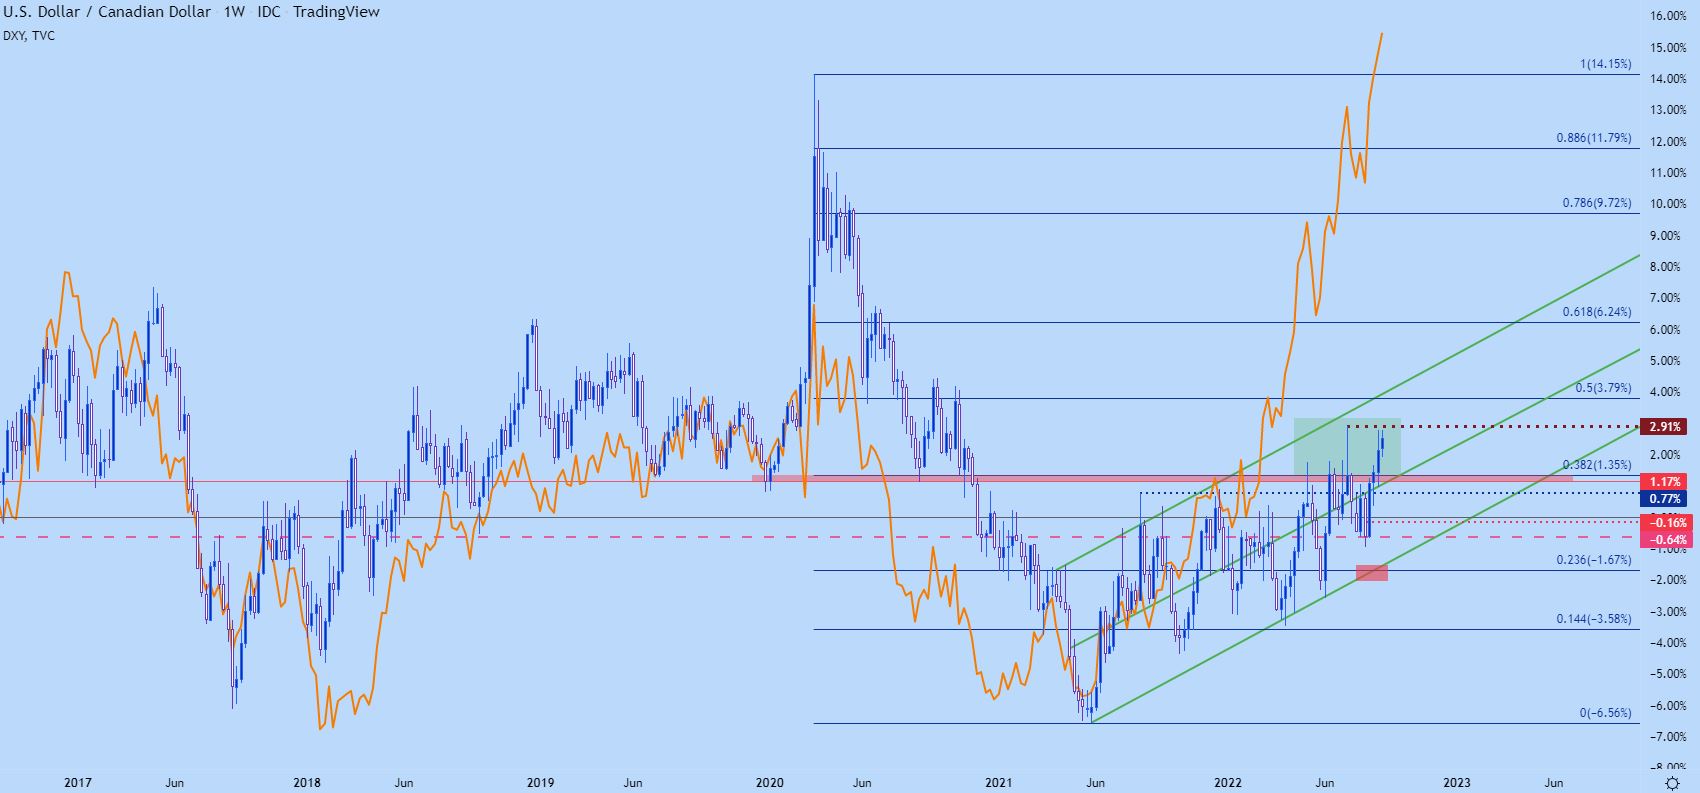
Chart prepared by James Stanley; USDCAD on Tradingview
USD/CAD Shorter-Term
The big question at this point is one of capitulation. Price has made a fast move back towards the recent high around 1.3225. There’s some posturing before a re-test, but if prices do push above that spot, there’s likely some stop orders for short positions. Those are, by nature, buy to cover orders which could lead to some additional demand on a test above those prior highs. The big question then is whether bulls can push up for a test of the 50% mark of that recent major move which plots around 1.3338. That price is also confluent with bear flag resistance, which makes for a case of possible capitulation if we do see a false breakout at 1.3225.
USD/CAD Weekly Price Chart
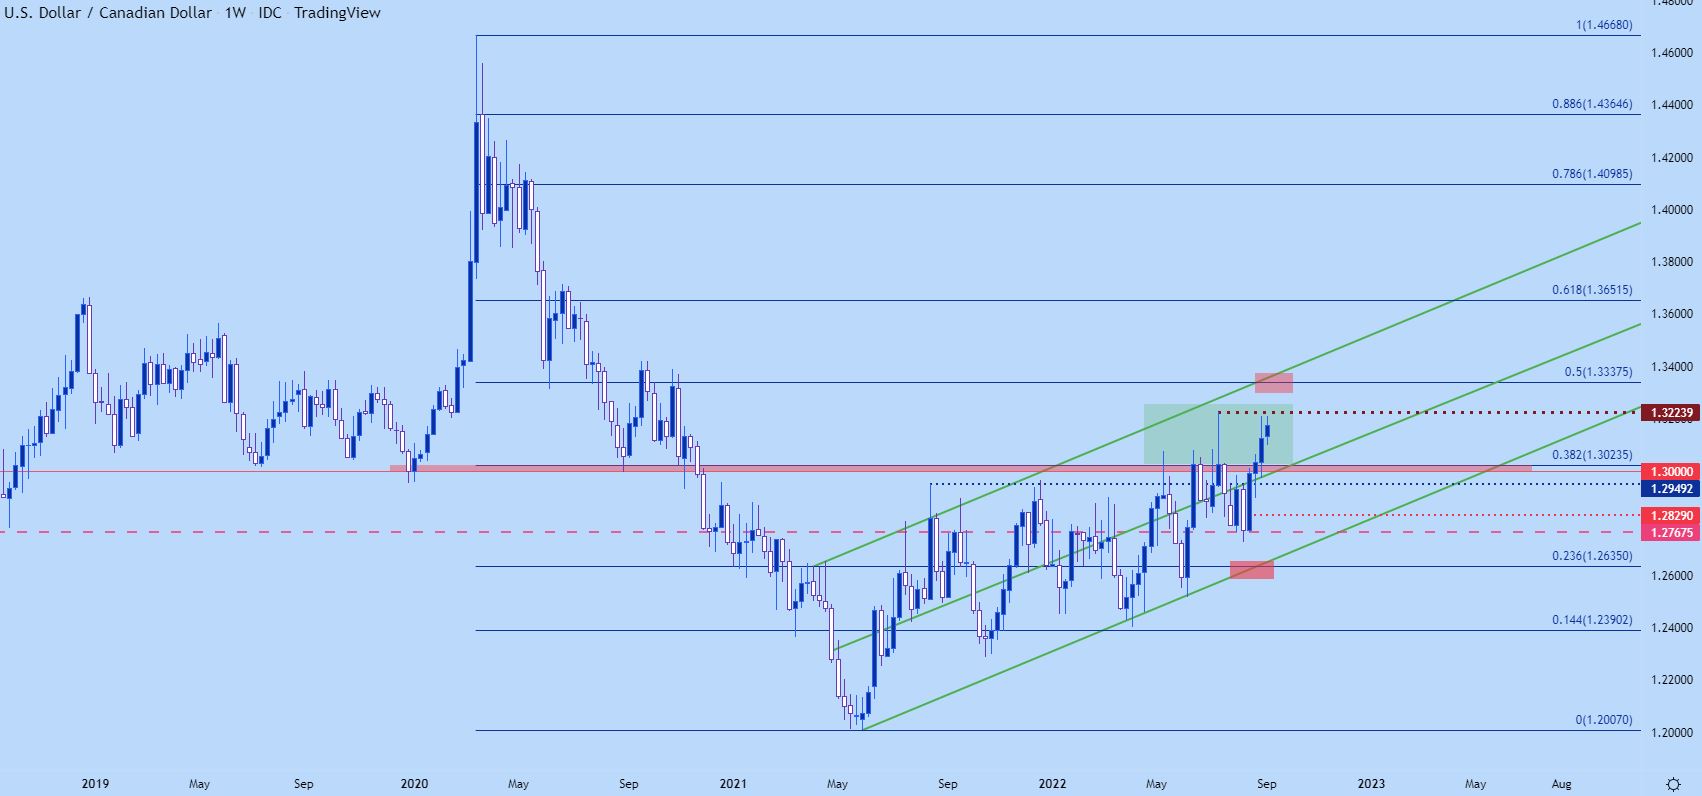
Chart prepared by James Stanley; USDCAD on Tradingview
USD/JPY
The big trend is finally facing a test. USD/JPY has been trading in a very aggressive manner lately with a strong bullish trend that’s only shown a minimum of pullback… until this morning. A trendline connecting lows over the past couple of days has finally been tested through – but support is so far showing up at an ideal spot, taken from prior resistance in the 144.21-144.39 area.
The trend has continued and already USD/JPY is pushing up to the 145.00 level. Price action came about a pip away from a test there earlier this morning and when something like that happens, resistance seems more of a pause point than anything.
That pullback has since shown in an somewhat orderly manner, with short-term price action showing support at prior resistance. This is where we can see how aggressively bulls want to continue working the move, and if that doesn’t hold, there’s more support potential deeper on the chart, around the 143.74-143.83 area, or perhaps even as deep as the 143.00 handle.
USD/JPY 15 Minute Chart
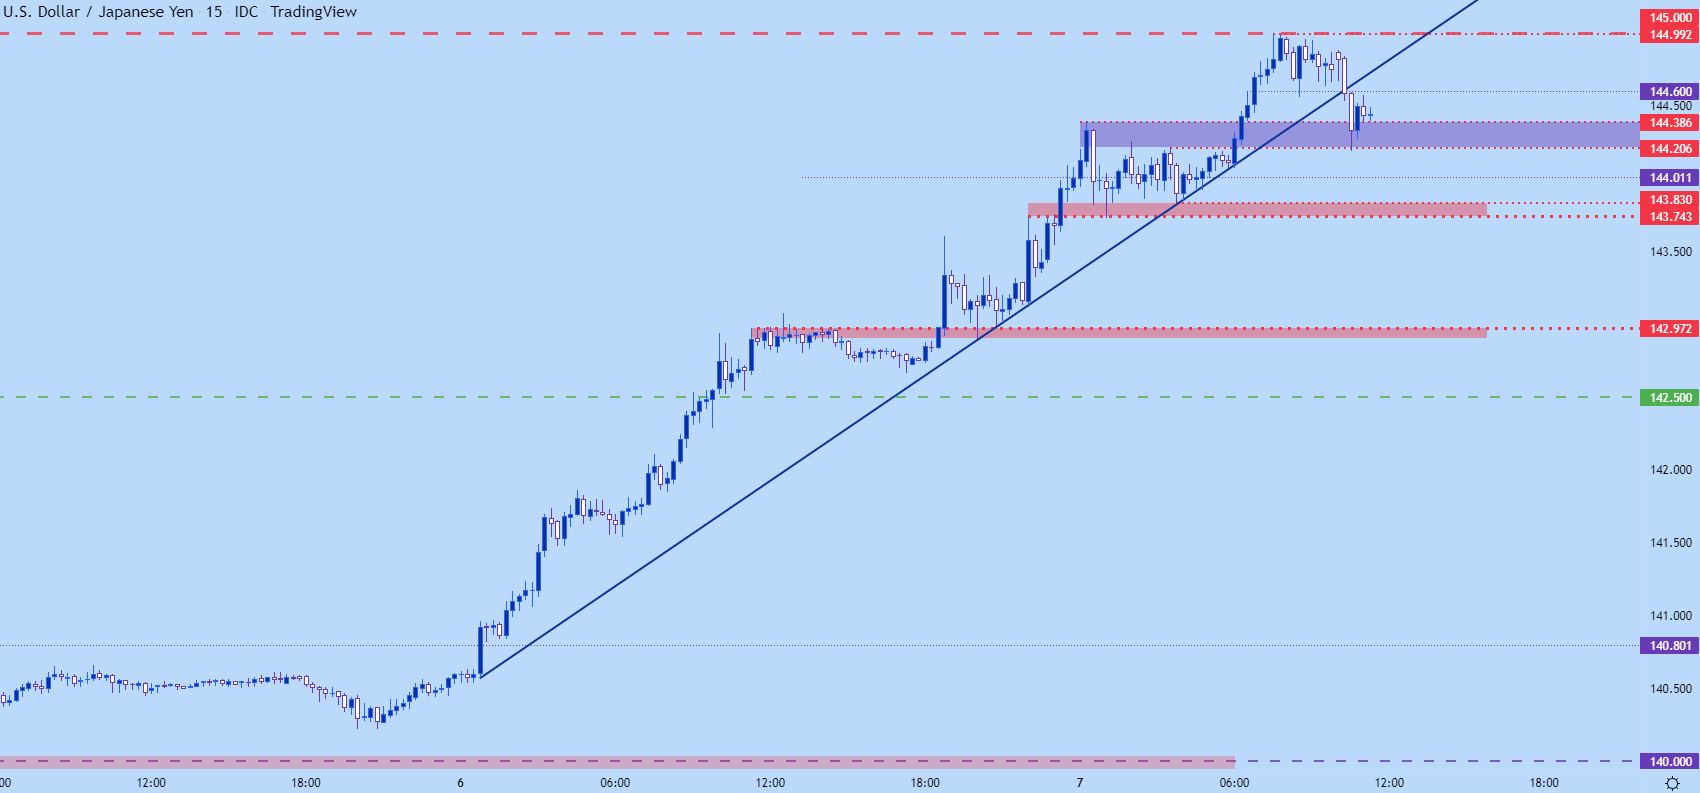
Chart prepared by James Stanley; USDJPY on Tradingview
— Written by James Stanley, Senior Strategist, DailyFX.com & Head of DailyFX Education
Contact and follow James on Twitter: @JStanleyFX