US Dollar Talking Points:
- It was a busy week across markets with latter-portion of the period bringing some large moves across equities and FX markets.
- The US Dollar broke-out to a fresh 20-year-high earlier this week but has since begun to pullback on the heels of yesterday’s ECB rate decision. The move was not clear-cut, as the initial response to the ECB was a pullback to support. But, that support held and led to a large rally overnight that’s helped to pull the US Dollar back below the 110.00 handle.
- The next two weeks around US markets will be very busy: The Fed goes into the blackout period on Saturday. CPI is released on Wednesday and there’s a large option expiry on Friday. The week after brings the September FOMC rate decision with high expectations for a 75 bp hike.
- The analysis contained in article relies on price action and chart formations. To learn more about price action or chart patterns, check out our DailyFX Education section.
Recommended by James Stanley
Download our US Dollar Forecast
The US Dollar has snapped back after yesterday’s European Central Bank rate decision.
There was a delayed response in the Euro but as I had highlighted in the Euro Price Action article yesterday, support had held thus far at an important spot on the chart, taken from around a prior resistance trendline that was starting to set-in as support. That resistance was part of a falling wedge formation, often approached with the aim of bullish reversals.
And given the area on the chart where that formation had built, right around the parity psychological level, it made sense that this could keep the door open for a pullback in the bearish move and given how long that short-side theme has been running, that pullback could possibly run for a bit.
For how long? Well, that’s likely going to be determined by fundamental headwinds. Dark clouds remain over Europe that may disallow any extended trends, unless there’s some help from the US side of the equation, or at least the perception of such, given the FOMC’s hawkish plans. Point blank, the ECB doesn’t appear to have as much firepower available as the Fed. Inflation remains far-elevated and problematic in both economies but, in Europe, there’s also the potential for an energy crisis and growth remains far more subdued, thereby limiting how hawkish the ECB may actually be able to get.
And then there’s the threat behind the matter – as continued weakness in EUR/USD could spell even more inflation for Europe, in spite of any rate hikes. This is why generally speaking the desired route for currencies is balance and when we don’t have that in the world’s largest FX markets, there’s a lot of opportunity for collateral damage.
USD
It was a tale of two trends in the Dollar this week as profound strength in the early-portion of the week led to a pullback in the latter-portion. But – interestingly, unlike recent USD breakouts – this move was not fueled in large part by the Euro. EUR/USD dawdled at support around that parity figure for much of the week – with aggressive trends of weakness showing in both the Yen and British Pound, which I’ll look into below.
In USD, the 110 handle was crossed this week for the first time since 2002. Wednesday marked the high but a bearish engulfing candlestick on the daily chart led to bearish momentum that’s continued so far through Friday trade. The prior resistance level at 109.14-109.27 notably held two resistance advances but, as yet, hasn’t shown much for support.
US Dollar Daily Chart
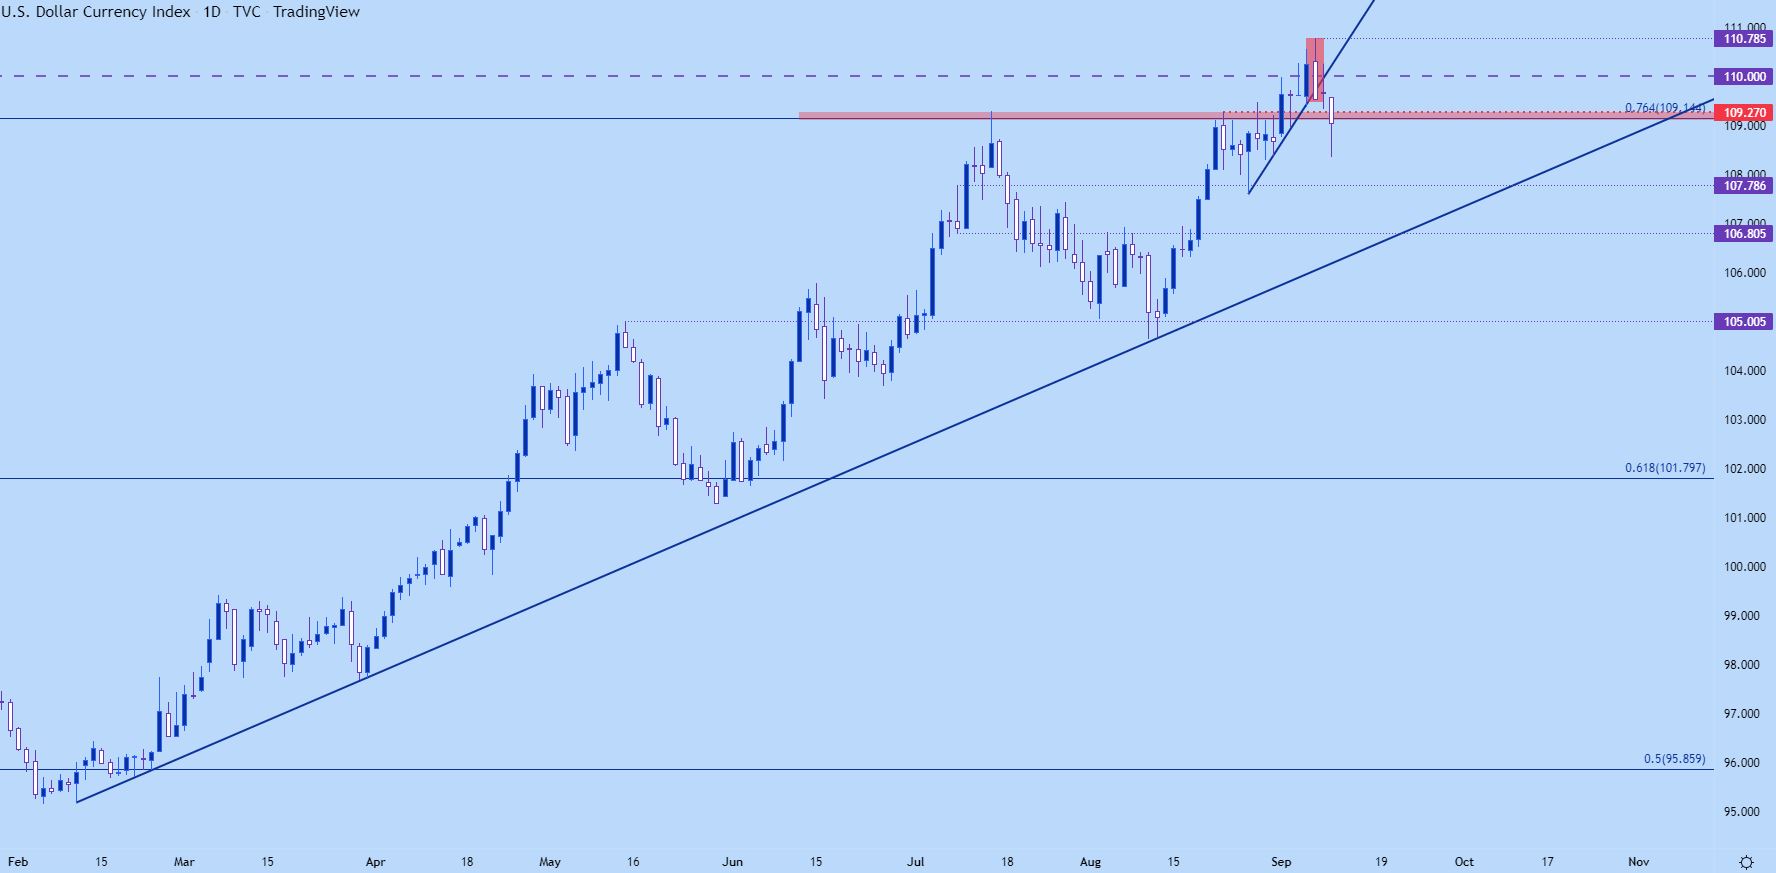
Chart prepared by James Stanley; USD, DXY on Tradingview
US Dollar Shorter-Term
The USD has set both a lower-low and lower-high on a shorter-term basis and this may be highlighting deeper pullback potential. For that series of bearish price behaviors to be invalidated we’ll need to see price break that chain but, for right now, there’s resistance potential around that key spot that sits from 109.14-109.27. Above that the 110 psychological level comes back into play and breach back-above that would highlight the possibility of invalidation of the bearish theme.
Recommended by James Stanley
Traits of Successful Traders
US Dollar Two-Hour Chart
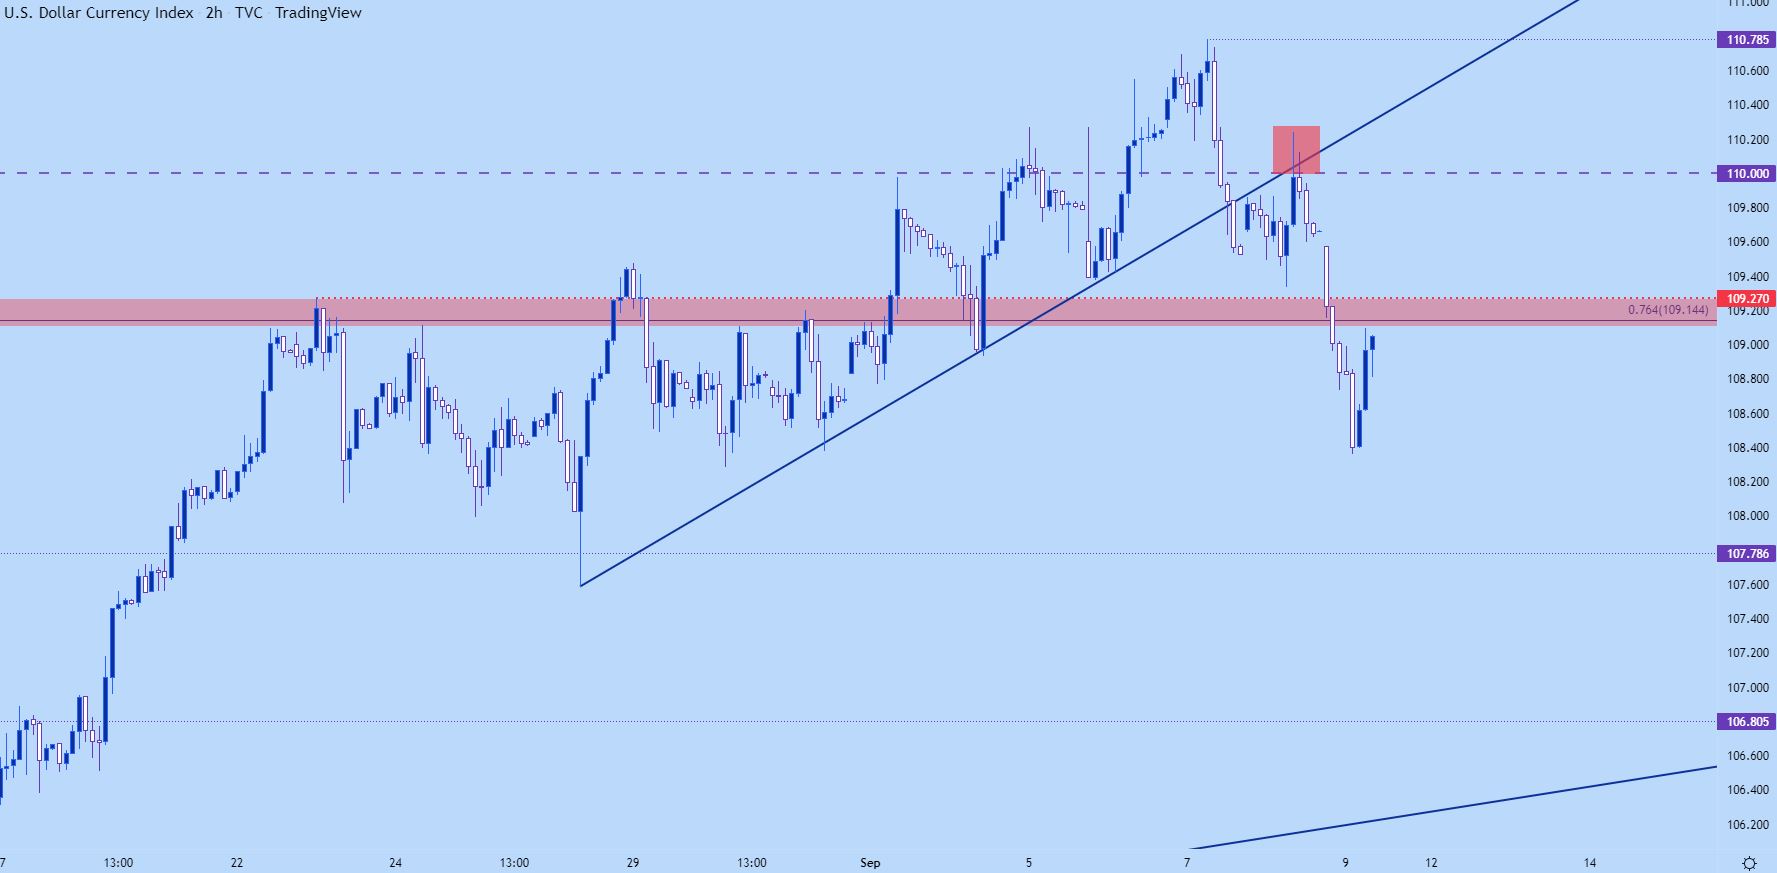
Chart prepared by James Stanley; USD, DXY on Tradingview
EUR/USD
I’ve looked into this from a few different angles over the past couple of weeks and this seems a good opportunity to highlight an important fact.
One can be bearish on the big picture trend but still entertain bullish setups along the way. And the reason for that is that no trends move in straight lines. It’s befuddling to me that simply mentioning a bullish setup, in anticipation of a counter-trend move, can be widely misconstrued as a bigger picture bullish bias.
My view on EUR/USD is that a level like parity should take some time to give way. That’s what happened when price broke above that level in 2002 when it took about six months for a strong EUR/USD trend to finally leave parity in the rearview. And this really speaks to the power of psychological levels and the importance of the EUR/USD spot rate to global economies – not just markets. Psychological levels are often drivers of human behaviors – and a price like .9999 will often feel much cheaper than just two pips below 1.0001.
Case in point – practically every retail operation that I’ve ever encountered sets prices that end in .99. It’s because it makes the product seem cheaper to the consumer! Well, the same thing happens in markets and in 2002, EUR/USD at 1.0001 felt much more expensive than just two pips above .9999, and that perception impacts market behaviors which then impacts price action.
If EUR/USD was to decisively cut through parity here with only a minimum of stall – I would be worried. Not just for the EUR/USD market but for the repercussions that may follow or be implied by such a violent move. Instead and what I think would be the ideal scenario, would be a slow breach of the level, such as we saw in 2002, where there was grindy price action met with pullbacks as longer-term shorts got squeezed and positioning became less bearish – so that eventually that bigger-picture trend can continue – just like we saw in 2002 going in the other direction.
EUR/USD Daily Chart
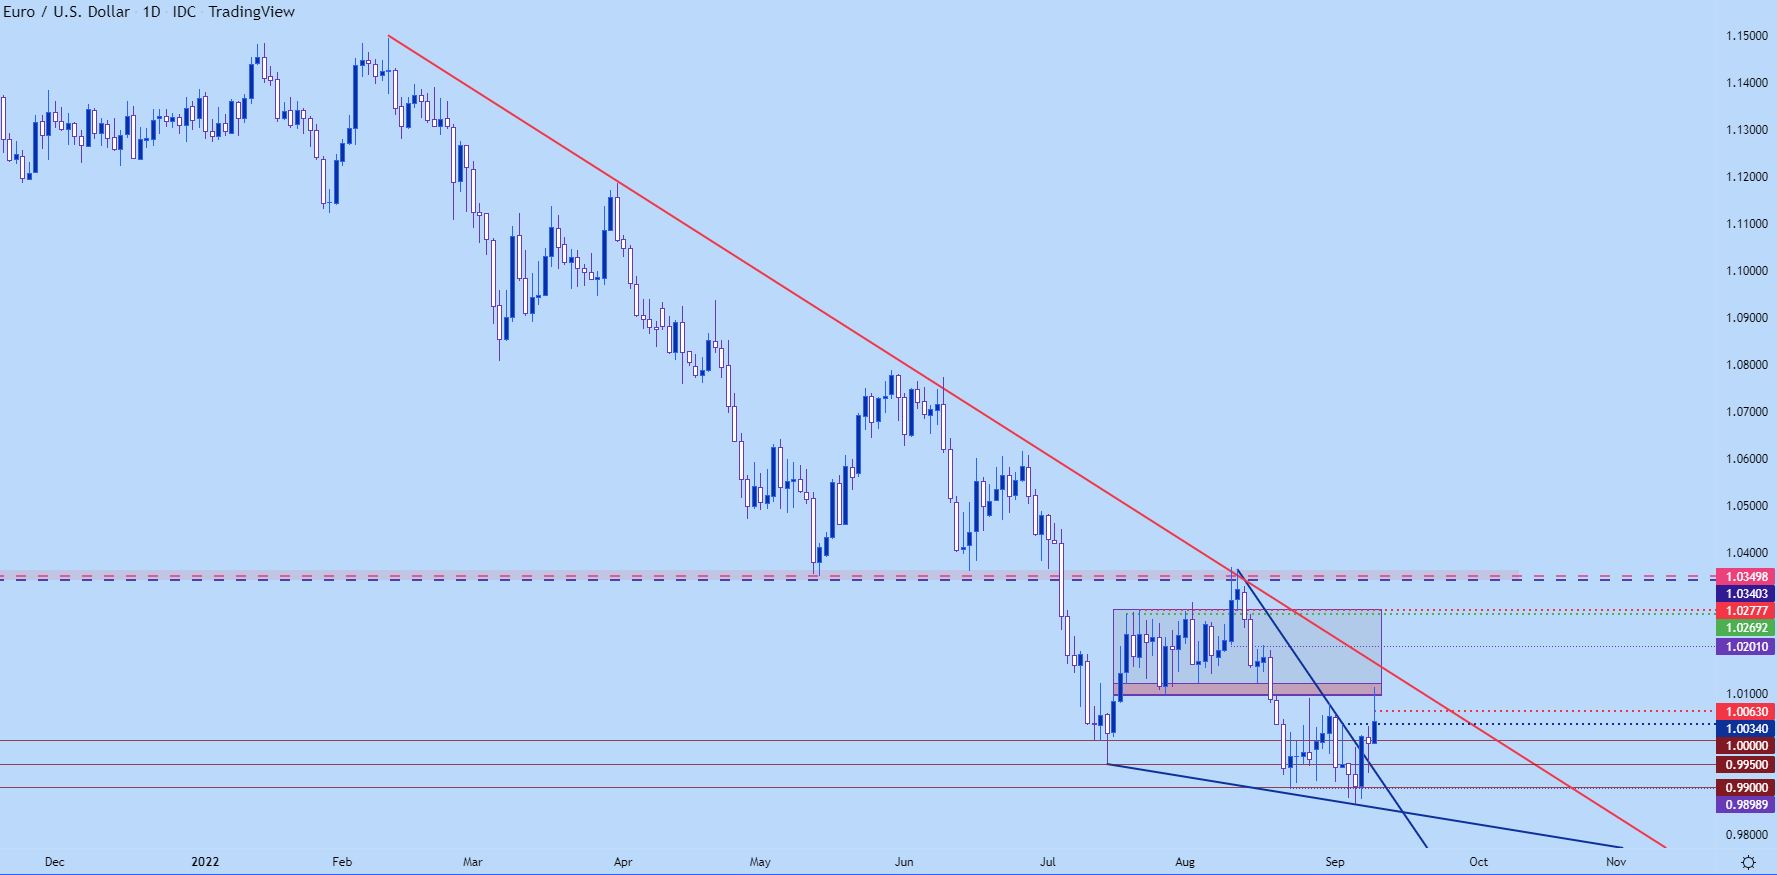
Chart prepared by James Stanley; EURUSD on Tradingview
The only problem is that the situation around Europe has been so dire that any bullish trends have had a very difficult time finding continuation – even short-squeeze scenarios, which have simply been opportunities for bears to trigger fresh shorts.
The question now is whether the ECB’s recent actions may have changed that dynamic a bit, and from short-term charts, we can see EUR/USD trying to string together a bullish trend. A hold above parity could keep this door open, which could allow for a higher-low above yesterday’s inflection around the .9950 level.
EUR/USD Two-Hour Price Chart
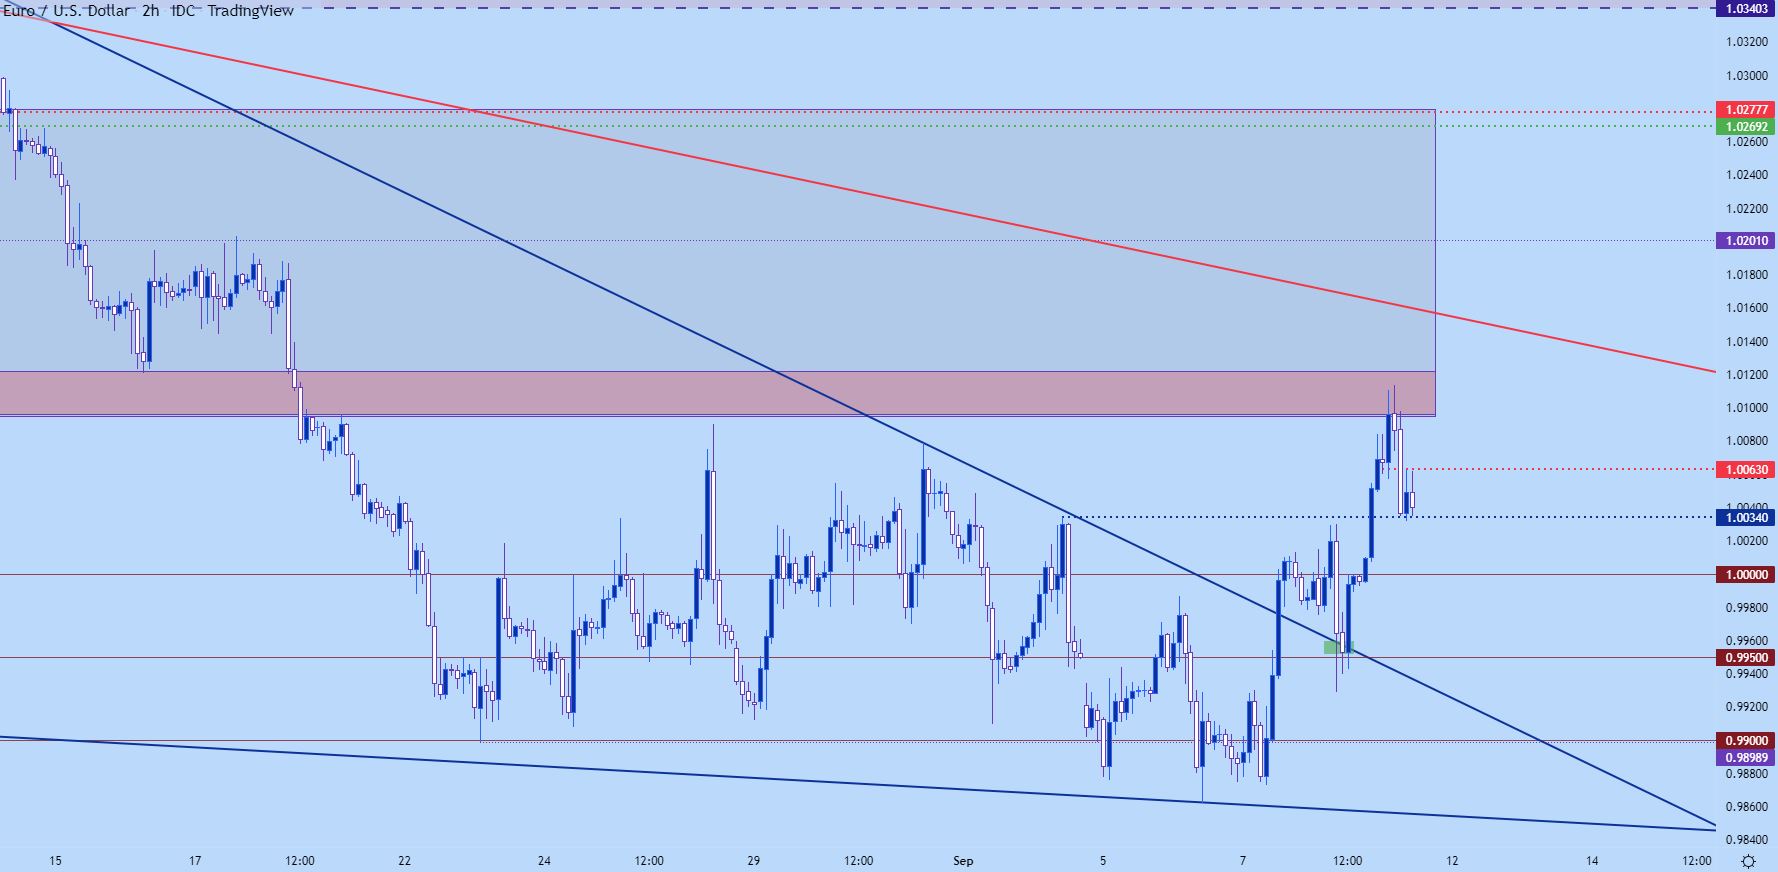
Chart prepared by James Stanley; EURUSD on Tradingview
GBP/USD
It was a threatening way to start the week for Cable and the pair quickly set a fresh 37-year-low. But -that’s since turned out to be a point of support and buyers are similarly pushing-higher here, trying to produce a stronger pullback in the bearish trend.
The levels that I looked at in the Wednesday installment of USD Price Action Setups remains in-play. Price has found resistance just inside of the 1.1650 level, which support showing around a prior price action swing. The 1.1500 level remains a massive area of interest and if price does fall through short-term support at 1.1560, then 1.1500 comes into play as a spot of possible support.
For next resistance – which could re-open the door for longer-term bearish scenarios, there’s potential at 1.1700 and the psychological level at 1.1750.
Recommended by James Stanley
Get Your Free GBP Forecast
GBP/USD Two-Hour Price Chart
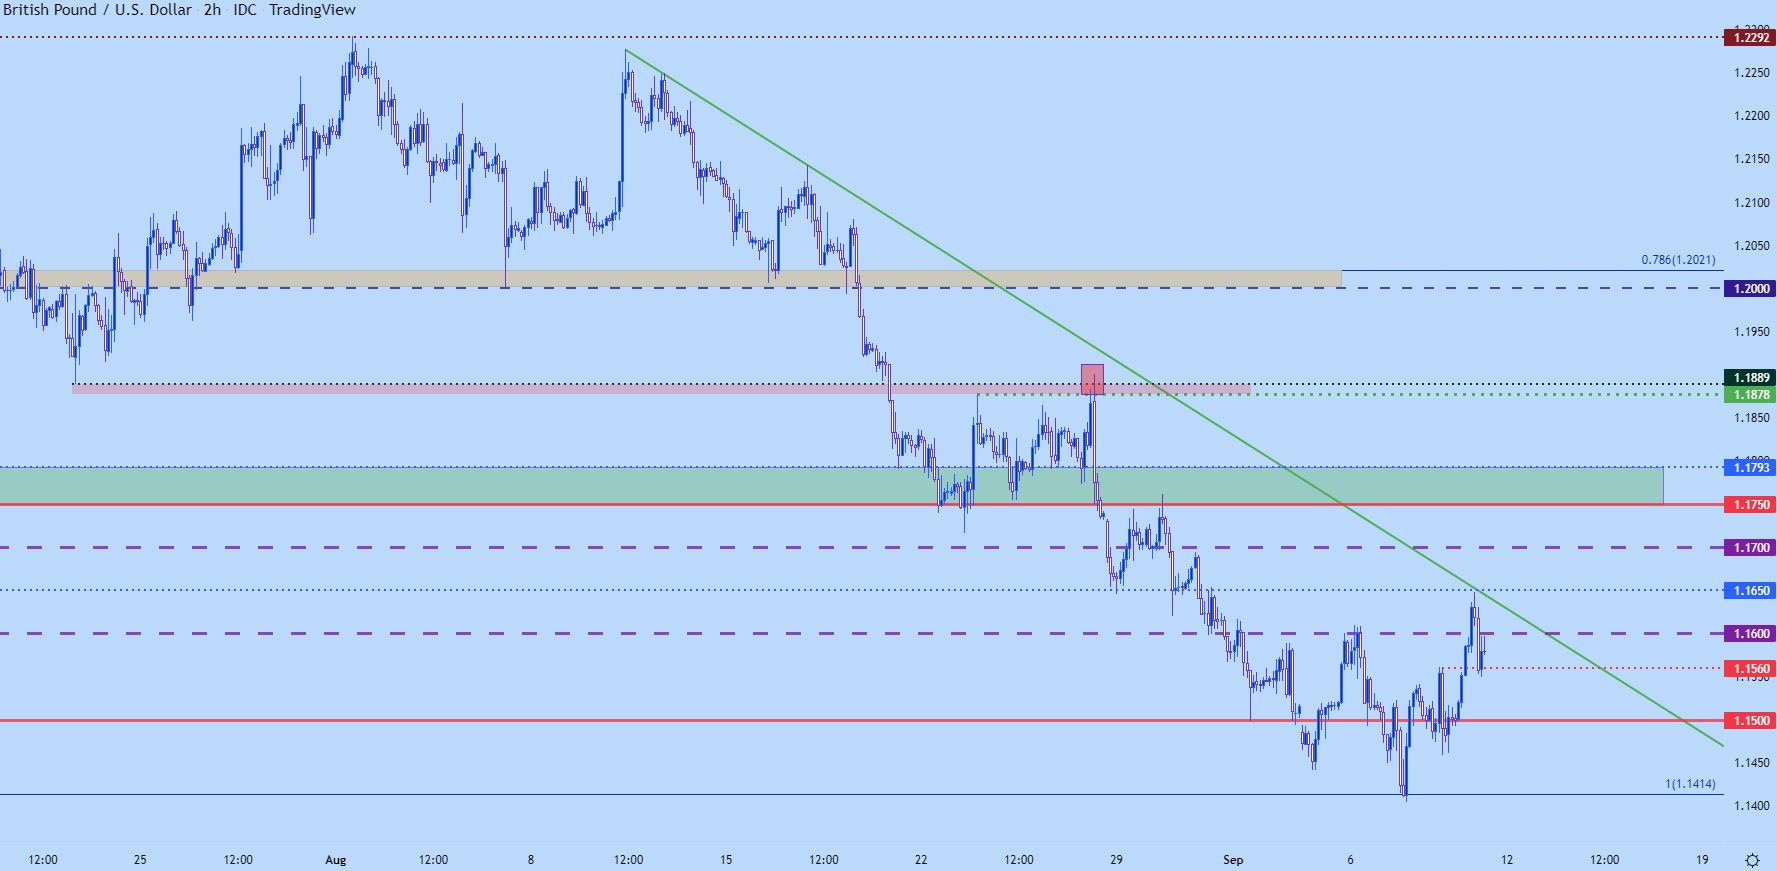
Chart prepared by James Stanley; GBPUSD on Tradingview
USD/CAD
There was also a rate hike out of Canada this week as the BoC hiked by 75 bps. The initial reaction was one of weakness as the pair made a strong push towards the yearly high – but ended up falling short as bulls slowed the approach before that level at 1.3224 could come into the picture.
As I had highlighted on Wednesday – there’s been some significant divergence between USD and USD/CAD trends, which could keep USD/CAD as an attractive option for bearish USD plays.
Given this week’s price action that bearish theme isn’t quite there yet as price remains above key support around the 1.3000 psychological level – but the fact that bulls failed to push the breakout could be a positive sign for a short-side theme that may be around the corner.
From the weekly chart below we can see that support from prior resistance in action, currently helping to hold the weekly bar lows. That’s also confluent with a mid-point of a bullish channel, which makes up a bear flag formation. So, this is a big spot on the chart and if sellers can evoke a push, the bearish side of the matter can soon become attractive again. But, for right now, we have support at prior resistance.
Recommended by James Stanley
Building Confidence in Trading
USD/CAD Weekly Price Chart
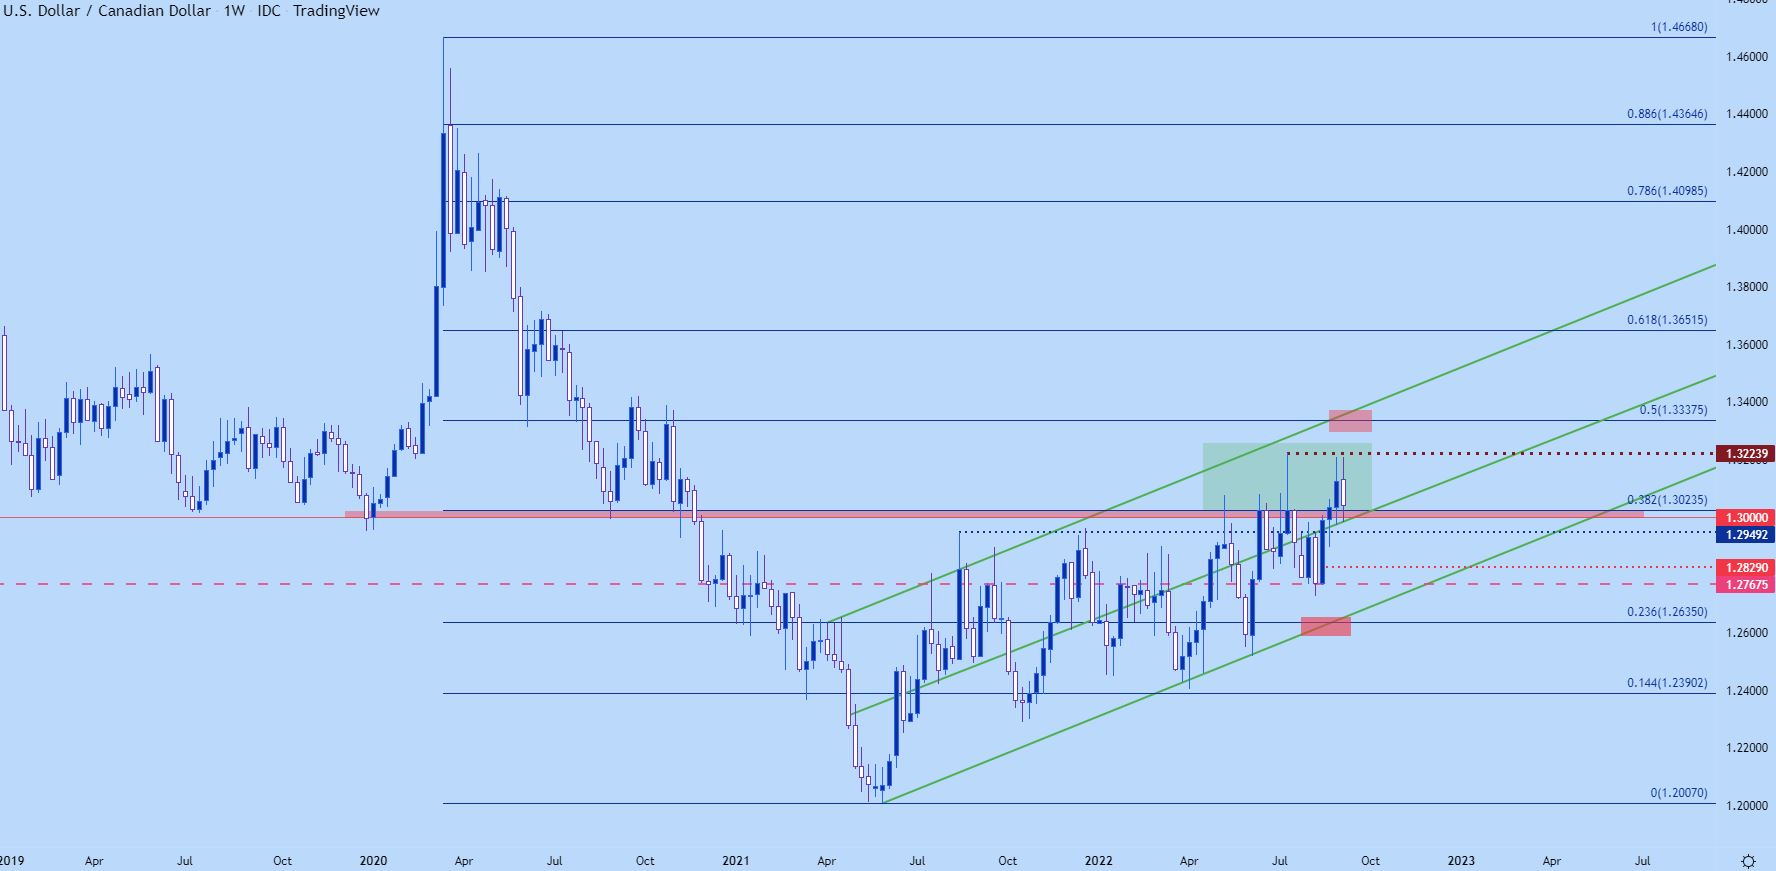
Chart prepared by James Stanley; USDCAD on Tradingview
USD/JPY
Feast and then famine for USD/JPY bulls, as the week started with a massive breakout that’s since seen about 50% of that weekly jump erased.
With a move this built-in on the basis of expectations for the BoJ to continue pumping, even the slightest hint of change can result in a pullback. The higher the trend runs and the longer it goes – the jumpier bulls are because once it turns – well that exit is only so wide. And this is why trends such as we’ve seen in USD/JPY often follow the ‘up the stairs, down the elevator’ logic.
USD/JPY came about one pip away from the 145.00 psychological level on Wednesday morning before pulling back. And then given some grumblings around the matter overnight, as covered by our own Richard Snow, that fear of change has come into the picture, and that’s brought on the ‘down the elevator’ type of move.
At this stage, price action is holding around the 50% marker of the recent breakout off of the 140.00 level. Near-term price action is still showing lower-lows and lower-highs from the two-hour chart, however, so there’s no evidence yet that the pullback is nearing conclusion. Going down even shorter-term may bring some hope to that picture, which I’ll look at in a moment.
USD/JPY Two-Hour Price Chart
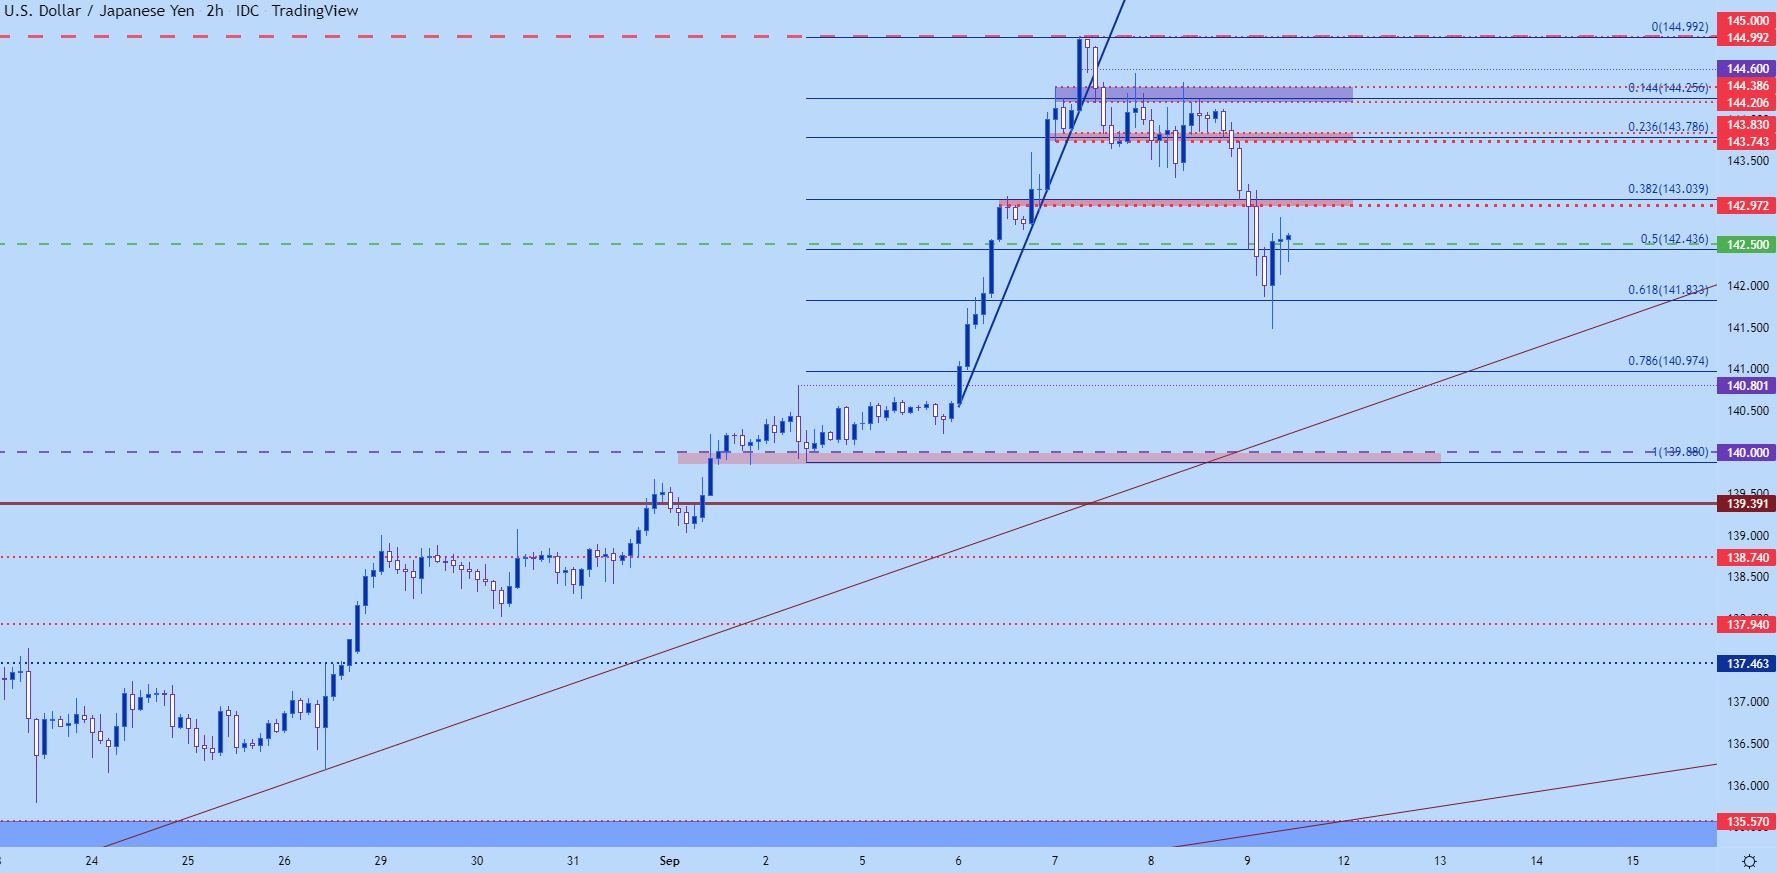
Chart prepared by James Stanley; USDJPY on Tradingview
USD/JPY Very Short-Term
This is Friday price action but from shorter-term charts, there may be an ongoing attempt from bulls to bring the bullish trend back. Price is currently trying to hold support around the 50% retracement of the recent breakout which is confluent with the 142.50 psychological level. Holding ground here would be a big show from bulls, and this would expose the 38.2% retracement of that move sits ahead as next resistance. If price can test up to that level, around the 143.00 handle, we could be seeing a greater build of higher-highs and lows on shorter-term charts.
Recommended by James Stanley
How to Trade USD/JPY
USD/JPY 30-Minute Chart
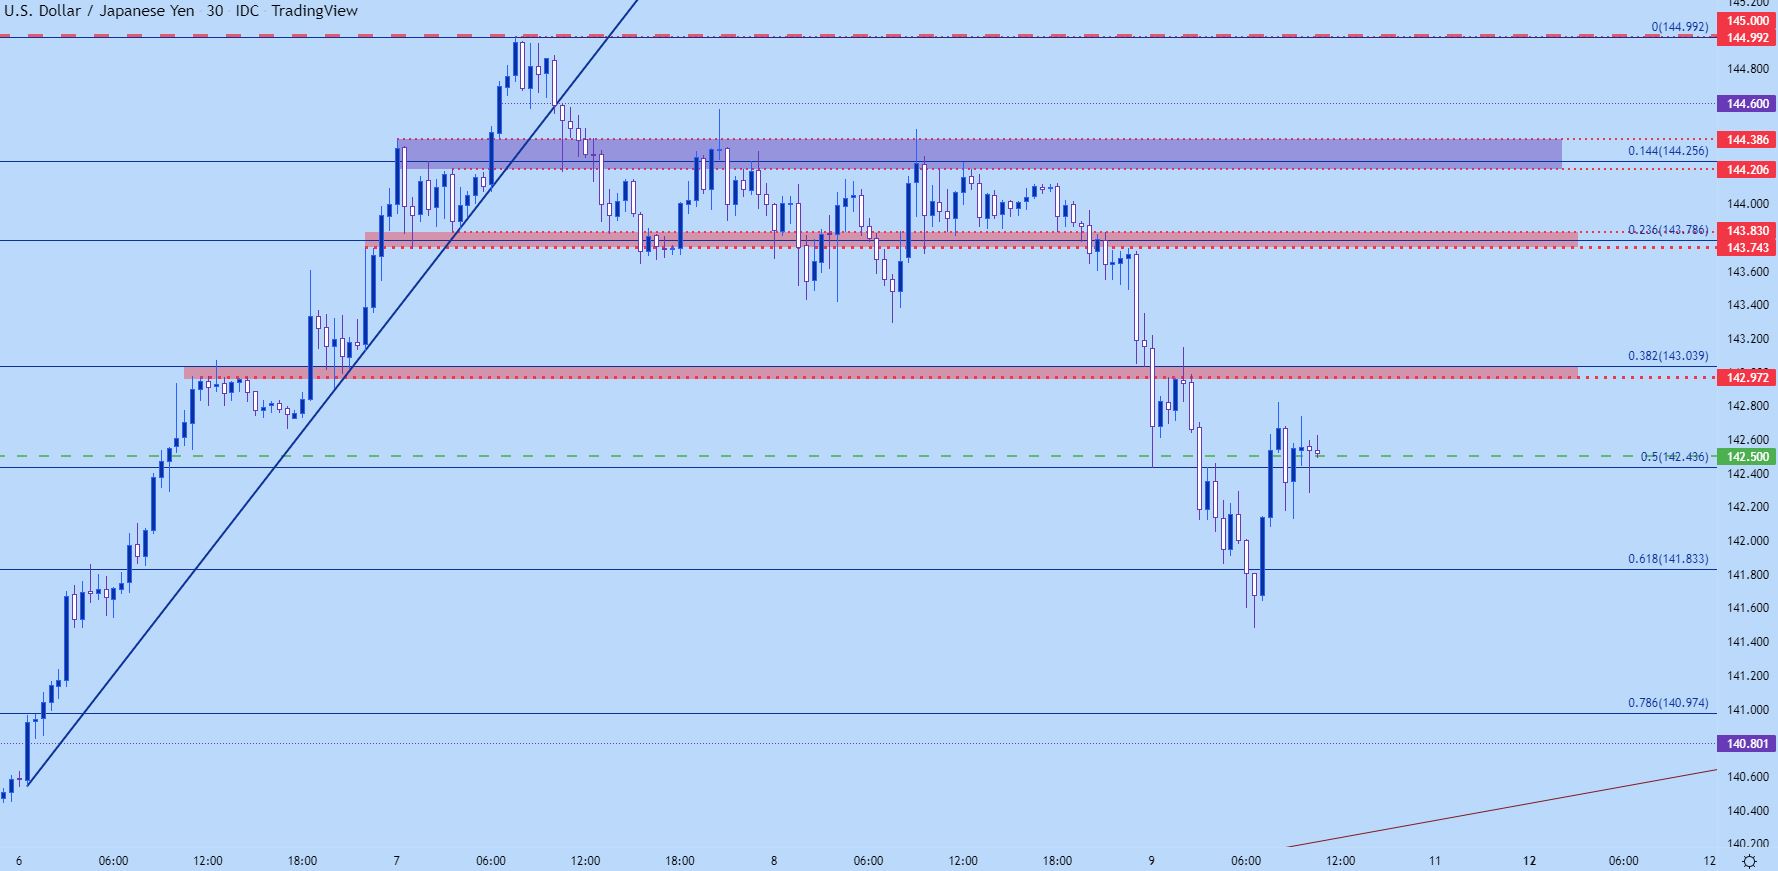
Chart prepared by James Stanley; USDJPY on Tradingview
— Written by James Stanley, Senior Strategist, DailyFX.com & Head of DailyFX Education
Contact and follow James on Twitter: @JStanleyFX