USD/JPY ANALYSIS & TALKING POINTS
- Banking crisis hangs over the heads of investors.
- FOMC under the spotlight today as economic slowdown concerns gain traction.
- Ascending triangle breakout potential on daily USD/JPY.
Recommended by Warren Venketas
Get Your Free JPY Forecast
JAPANESE YEN FUNDAMENTAL BACKDROP
The Japanese Yen received some much needed support both yesterday and today from risk aversion in financial markets as recessionary fears grow. Although important market influencers like the JP Morgan CEO Jamie Dimon stated that he believes the crisis is nearing its end, market participants shrugged off this sentiment in favor of a more cautious approach and preference for safe-haven assets including the Yen.
Trade Smarter – Sign up for the DailyFX Newsletter
Receive timely and compelling market commentary from the DailyFX team
Subscribe to Newsletter
US regional banking shares plummeted yesterday allowing for possible confusion for the FOMC in their decision making later this evening; however, I do not believe this will trump money market pricing. Currently, the implied Fed funds futures (see table below) remains firmly skewed towards a 25bps interest rate hike, sending the lending rate to its highest level since 2007.
FEDERAL RESERVE INTEREST RATE PROBABILITIES
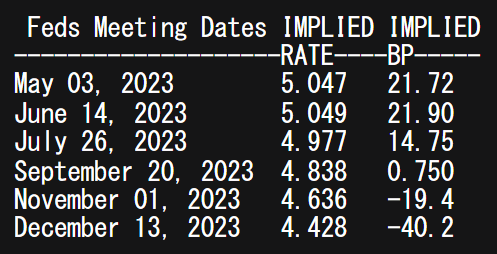
Source: Refinitiv
The rest of the day is littered with US economic data that’s expected to provide short-term volatility throughout, with no Japanese specific data to speak of. Some valuable data inputs include the ADP employment change figure as well as the ISM services PMI print (always a high impact event considering the US is primarily a services driven economy). Overall, it is unlikely these singular releases will not change the Fed’s decision but will give markets an indication as to the state of the US economy going forward.
ECONOMIC CALENDAR
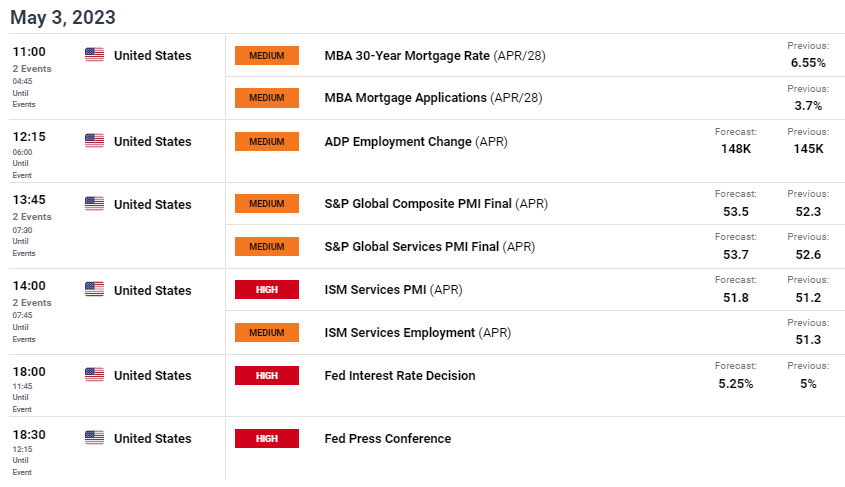
Source: DailyFX economic calendar
TECHNICAL ANALYSIS
Introduction to Technical Analysis
Candlestick Patterns
Recommended by Warren Venketas
USD/JPY DAILY CHART
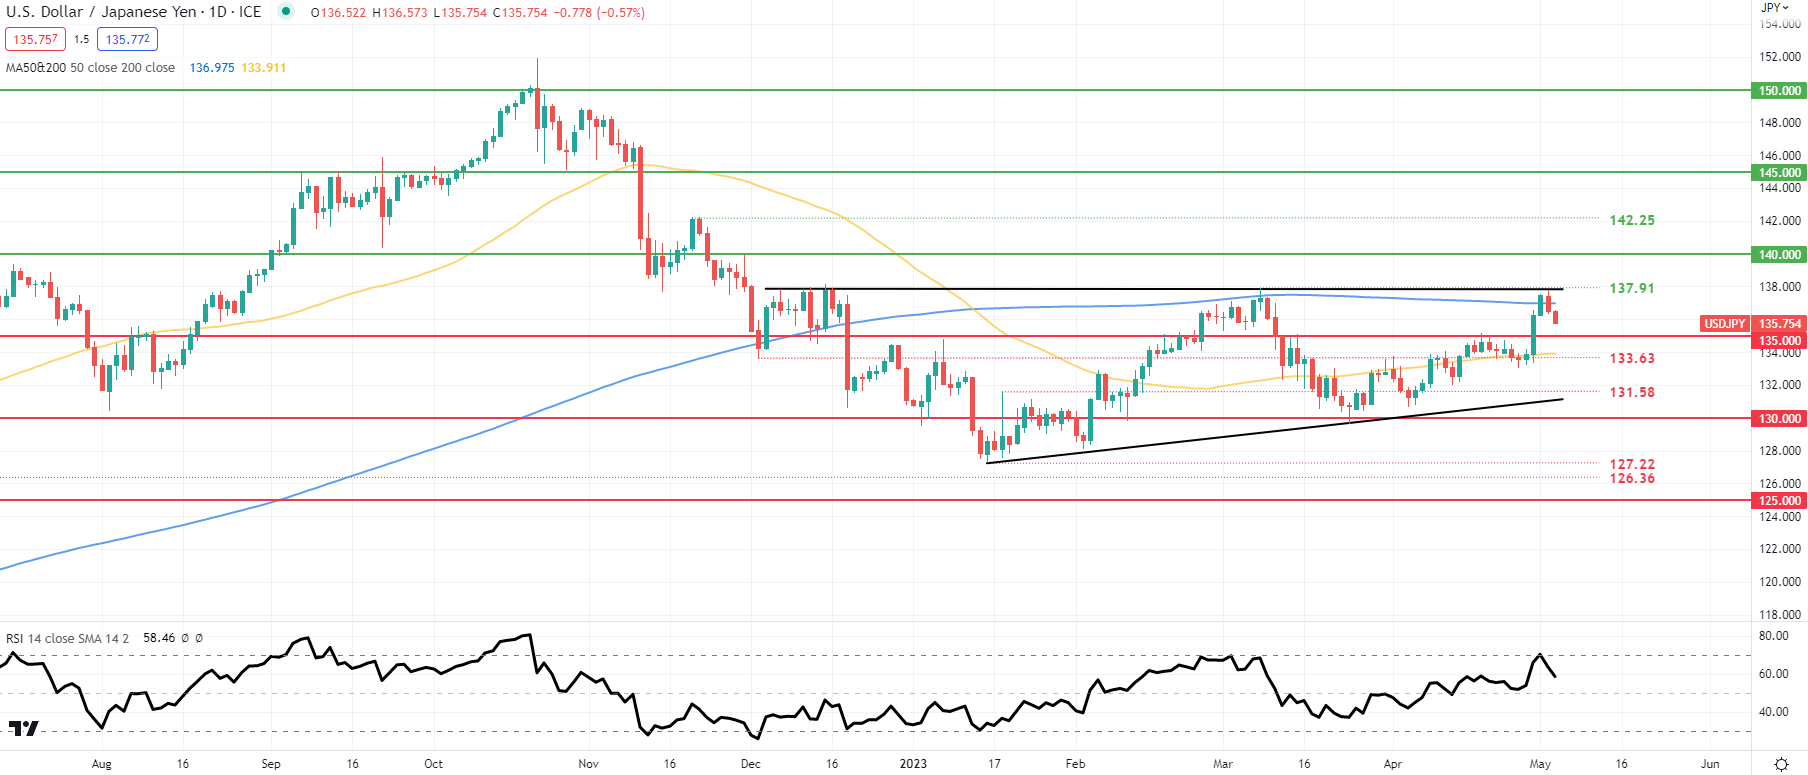
Chart prepared by Warren Venketas, IG
The daily USD/JPY chart shows price action respective of the medium-term ascending triangle pattern (black). Bears have defended triangle support which coincides with the 200-day moving average (blue) and the 137.91 March swing high. The Relative Strength Index (RSI) has also come off overbought levels and may suggest a dovish slant to today’s data from a technical standpoint, possibly exposing the 135.00 psychological support handle once more. Any downside move could be invalidated by a triangle resistance breakout and confirmation candle close thereby leaving the door open for another run up to 140.00 and beyond, last seen at the backend of 2022.
Key resistance levels:
- 137.91/Triangle resistance
- 200-day MA (blue)
Key support levels:
- 135.00
- 133.63/50-day MA (yellow)
- 131.58
IG CLIENT SENTIMENT: MIXED
IGCS shows retail traders are currently net SHORT on USD/JPY, with 69% of traders currently holding short positions (as of this writing). At DailyFX we take a contrarian view on sentiment; however, due to recent changes in long and short positioning, we arrive at a short-term cautious disposition.
Contact and followWarrenon Twitter:@WVenketas